- Page 1 and 2:
S O C I O - E C O N O M I C R E V I
- Page 4 and 5:
S O C I O - E C O N O M I C R E V I
- Page 6:
TABLE OF CONTENTS 1. Introduction 7
- Page 9 and 10:
There are four key steps for such a
- Page 11 and 12:
• The first is macroeconomic stab
- Page 13 and 14:
In this chapter we will chart the b
- Page 15 and 16:
(O’Connor et. al., 2012: 69). The
- Page 17 and 18:
What are the reasons for the emerge
- Page 19 and 20:
produce greater and more lasting pr
- Page 21 and 22:
esembles the German tradition of or
- Page 23 and 24:
market, became the first country to
- Page 25 and 26:
the European Stability Mechanism (E
- Page 27 and 28:
Chart 2.11 Comparison of 10-year Go
- Page 29 and 30:
pressing concerns surrounding the l
- Page 31 and 32:
2.1.3 The Troika programme, 2010-20
- Page 33 and 34:
Table 2.6 - Poverty and Deprivation
- Page 35 and 36:
a reduction in total expenditure (i
- Page 37 and 38:
Table 2.7 - A policy framework for
- Page 39 and 40:
Chart 2.13 - Maturity Dates of Iris
- Page 41 and 42:
These figures are from an extremely
- Page 43 and 44:
A key part of Ireland’s industria
- Page 45 and 46:
Employment has finally begun to ris
- Page 47 and 48:
is becoming ever more urgent for Ir
- Page 49 and 50:
c) New Indicators Creating a sustai
- Page 51 and 52:
analysed in this section, indicates
- Page 53 and 54:
weekly income level will be counted
- Page 55 and 56:
Table 3.3: The numbers of people be
- Page 57 and 58:
Table 3.5 looks at adults only and
- Page 59 and 60:
This reflected the rise in unemploy
- Page 61 and 62:
2001. These are the years that the
- Page 63 and 64:
Table 3.11: Levels of deprivation f
- Page 65 and 66:
Moving to persistent poverty Social
- Page 67 and 68:
Chart 3.1: Percentage difference in
- Page 69 and 70:
the years to come (Mallon and Healy
- Page 71 and 72:
Chart 3.3: Ireland’s Income Distr
- Page 73 and 74:
Table 3.15: The distribution of hou
- Page 75 and 76:
Table 3.17: Gini coefficient measur
- Page 77 and 78:
Individualising social welfare paym
- Page 79 and 80:
for every euro earned the person wi
- Page 81 and 82:
• Provide substantial new measure
- Page 83 and 84:
Table 4.1: The changing nature of I
- Page 85 and 86:
Looking to the years immediately ah
- Page 87 and 88:
may be some return from a number of
- Page 89 and 90:
Taxation and competitiveness Anothe
- Page 91 and 92:
Reforming and broadening the tax ba
- Page 93 and 94:
Analysis of High Income Individuals
- Page 95 and 96:
with little benefit in terms of job
- Page 97 and 98:
Results from Census 2011 indicated
- Page 99 and 100:
• The major components of these a
- Page 101 and 102:
Standard rating discretionary tax e
- Page 103 and 104:
Although all of the income taxation
- Page 105 and 106:
demonstrates the equity attached to
- Page 107 and 108:
• Would incentivise employment ov
- Page 109 and 110:
this complexity vary but they are f
- Page 111 and 112:
S O C I O - E C O N O M I C R E V I
- Page 113 and 114:
This transformation in the labour m
- Page 115 and 116:
Table 5.3: Unemployment in Ireland,
- Page 117 and 118:
Previous experiences, in Ireland an
- Page 119 and 120:
The Live Register While the live re
- Page 121 and 122:
Even the most optimistic economic a
- Page 123 and 124:
The need to recognise voluntary wor
- Page 125 and 126:
- Ensure that the social welfare sy
- Page 127 and 128:
increasing taxation in Ireland has
- Page 129 and 130:
library services Libraries play an
- Page 131 and 132:
cent in households in the bottom 20
- Page 133 and 134:
the supply of these services. Socia
- Page 135 and 136:
Sports A report carried out by Inde
- Page 137 and 138:
developments. Complex regulation al
- Page 139 and 140:
Housing: a New philosophy Given the
- Page 141 and 142:
subsequent failure to implement a s
- Page 143 and 144:
Table 7.2- Population and housing s
- Page 145 and 146:
Social Justice Ireland believes tha
- Page 147 and 148:
or green areas and are located a go
- Page 149 and 150:
Table 7.5 - Mortgage Arrears Jun-12
- Page 151 and 152:
country. The most recent assessment
- Page 153 and 154:
(25 per cent) of households, with t
- Page 155 and 156:
Table 7.8 Percentage distribution o
- Page 157 and 158:
esulting in this mechanism becoming
- Page 159 and 160:
2013 nearly 2000 units were leased
- Page 161 and 162:
Social Justice Ireland has also pre
- Page 163 and 164:
Housing and children Factors which
- Page 165 and 166:
• Government should also meet com
- Page 167 and 168:
poverty and Health Health is not ju
- Page 169 and 170:
life expectancy According to Eurost
- Page 171 and 172:
Health stating that it will not be
- Page 173 and 174:
Table 8.2 - EU 27 Expenditure on He
- Page 175 and 176:
Figure 8.1 - Expenditure on health
- Page 177 and 178:
older people’s services Although
- Page 179 and 180:
people in their own homes/communiti
- Page 181 and 182:
Children and family services There
- Page 183 and 184:
catchment areas and community menta
- Page 185 and 186:
The sustained high level of suicide
- Page 187 and 188:
• Continue to facilitate and fund
- Page 189 and 190:
Education in Ireland - the numbers
- Page 191 and 192:
with significant increases projecte
- Page 193 and 194:
for both individuals and the state
- Page 195 and 196:
cause of considerable concern for p
- Page 197 and 198:
Department has transferred responsi
- Page 199 and 200:
minimum of 30 per cent of all enrol
- Page 201 and 202:
costs, repaying such borrowing when
- Page 203 and 204:
communities. Census 2011 showed tha
- Page 205 and 206:
Refugees and Asylum Seekers Until r
- Page 207 and 208:
Social Justice Ireland proposes tha
- Page 209 and 210:
This emigration ‘brain drain’,
- Page 211 and 212:
Backbenchers have little control ov
- Page 213 and 214:
economic, social and community deve
- Page 215 and 216: over many years by Government. In r
- Page 217 and 218: seen as the key to resolving many a
- Page 219 and 220: Ireland. The common good must be at
- Page 221 and 222: downplay as externalities. Shadow n
- Page 223 and 224: All areas of governance, from inter
- Page 225 and 226: the failure by governments to imple
- Page 227 and 228: natural resources is required to en
- Page 229 and 230: climate policy across all Governmen
- Page 231 and 232: economy. Capital investment will be
- Page 233 and 234: environmental taxation. Eco-taxes,
- Page 235 and 236: Rural and Regional Development The
- Page 237 and 238: away from a focus dominated by agri
- Page 239 and 240: Rural development and the challenge
- Page 241 and 242: public services and rural transport
- Page 243 and 244: to oversee six pilot programmes to
- Page 245 and 246: Table 13.1: Distribution of Family
- Page 247 and 248: Key policy priorities on Rural Deve
- Page 249 and 250: addressed urgently as part of the C
- Page 251 and 252: leaders promised to work together t
- Page 253 and 254: In order to ensure good governance,
- Page 255 and 256: • Sustainability should be the co
- Page 257 and 258: vision of zero new HIV infections,
- Page 259 and 260: S O C I O - E C O N O M I C R E V I
- Page 261 and 262: as sufficient to ensure that everyo
- Page 263 and 264: achieve his or her potential only i
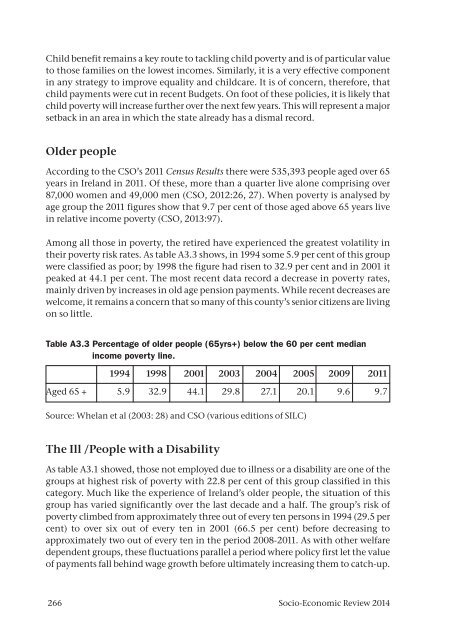
- Page 265: they live with sufficient income su
- Page 269 and 270: poverty by region and area Recent S
- Page 271 and 272: the home due to a combination of th
- Page 273 and 274: These results, which complement ear
- Page 275 and 276: transition from boom to recession o
- Page 277 and 278: until Budget 2005. At its first opp
- Page 279 and 280: Table A4.1: Total tax revenue as a
- Page 281 and 282: Effective tax rates To complement t
- Page 283 and 284: Income taxation and the income dist
- Page 285 and 286: Chart A4.3: VAT and excise duties a
- Page 287 and 288: figure increased by almost one mill
- Page 289 and 290: S O C I O - E C O N O M I C R E V I
- Page 291 and 292: A7.4 Net Household Need 1993-2013 y
- Page 293 and 294: Transport • Ireland’s car densi
- Page 295 and 296: land use • In 2010, 10.7% of Irel
- Page 297 and 298: goal 6: Combat HIv/AIDS, malaria an
- Page 299 and 300: Browne, M. (2007) The Right Living
- Page 301 and 302: Central Statistics Office (2006) In
- Page 303 and 304: Daft (2013) Daft.ie rental report 2
- Page 305 and 306: Department of Environment, Communit
- Page 307 and 308: Department of Health (2012) Annual
- Page 309 and 310: Environmental Protection Agency (20
- Page 311 and 312: Eurostat (2013) Internet access and
- Page 313 and 314: Healy, S and Reynolds, B. (2003)
- Page 315 and 316: International Monetary Fund (2012)
- Page 317 and 318:
National Anti-Poverty Strategy (199
- Page 319 and 320:
Perkins, R., G. Sheil, B. Merriman,
- Page 321 and 322:
United Nations Programme on HIV/AID
- Page 326:
There is an extraordinary reluctanc