download file
download file
download file

You also want an ePaper? Increase the reach of your titles
YUMPU automatically turns print PDFs into web optimized ePapers that Google loves.
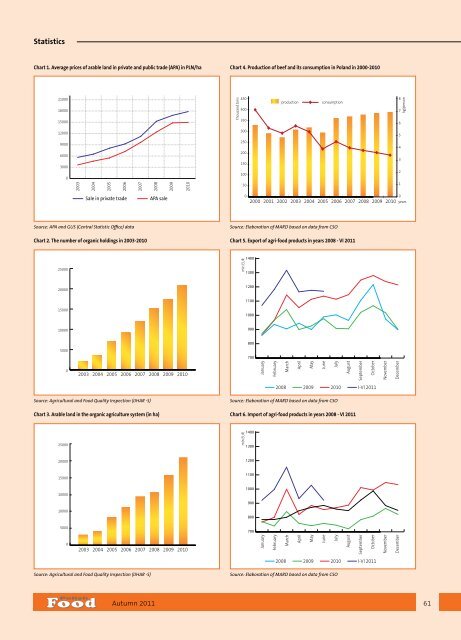
Statistics<br />
Chart 1. Average prices of arable land in private and public trade (APA) in PLN/ha<br />
Chart 4. Production of beef and its consumption in Poland in 2000-2010<br />
21000<br />
18000<br />
15000<br />
thousand tons<br />
450<br />
400<br />
350<br />
production<br />
consumption<br />
8<br />
7<br />
6<br />
kg/person<br />
12000<br />
300<br />
5<br />
9000<br />
6000<br />
3000<br />
0<br />
250<br />
200<br />
150<br />
100<br />
4<br />
3<br />
2<br />
2003<br />
2004<br />
2005<br />
2006<br />
2007<br />
2008<br />
2009<br />
2010<br />
50<br />
1<br />
Sale in private trade<br />
APA sale<br />
0<br />
0<br />
2000 2001 2002 2003 2004 2005 2006 2007 2008 2009 2010 years<br />
Source: APA and GUS (Central Statistic Office) data<br />
Chart 2. The number of organic holdings in 2003-2010<br />
Source: Elaboration of MARD based on data from CSO<br />
Chart 5. Export of agri-food products in years 2008 - VI 2011<br />
25000<br />
mln EUR<br />
1400<br />
1300<br />
20000<br />
1200<br />
1100<br />
15000<br />
1000<br />
10000<br />
900<br />
800<br />
5000<br />
700<br />
0<br />
2003 2004 2005 2006 2007 2008 2009 2010<br />
January<br />
February<br />
March<br />
April<br />
May<br />
June<br />
July<br />
August<br />
September<br />
October<br />
November<br />
December<br />
2008<br />
2009 2010 I-VI 2011<br />
Source: Agricultural and Food Quality Inspection (IJHAR -S)<br />
Chart 3. Arable land in the organic agriculture system (in ha)<br />
Source: Elaboration of MARD based on data from CSO<br />
Chart 6. Import of agri-food products in years 2008 - VI 2011<br />
25000<br />
mln EUR<br />
1400<br />
1300<br />
20000<br />
1200<br />
15000<br />
1100<br />
10000<br />
1000<br />
900<br />
10000<br />
800<br />
5000<br />
700<br />
0<br />
2003 2004 2005 2006 2007 2008 2009 2010<br />
January<br />
February<br />
March<br />
April<br />
May<br />
June<br />
July<br />
August<br />
September<br />
October<br />
November<br />
December<br />
2008<br />
2009 2010 I-VI 2011<br />
Source: Agricultural and Food Quality Inspection (IJHAR -S)<br />
Source: Elaboration of MARD based on data from CSO<br />
Autumn 2011 61