Competitive Power Ventures, Inc. - Energy Highway
Competitive Power Ventures, Inc. - Energy Highway
Competitive Power Ventures, Inc. - Energy Highway
You also want an ePaper? Increase the reach of your titles
YUMPU automatically turns print PDFs into web optimized ePapers that Google loves.
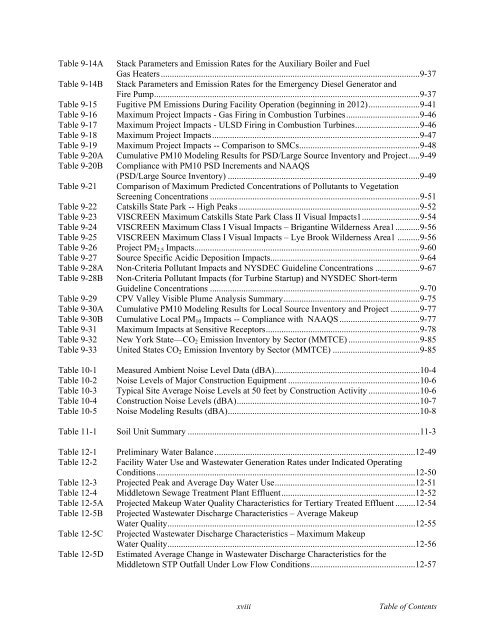
Table 9-14A Stack Parameters and Emission Rates for the Auxiliary Boiler and Fuel<br />
Gas Heaters....................................................................................................................9-37<br />
Table 9-14B Stack Parameters and Emission Rates for the Emergency Diesel Generator and<br />
Fire Pump.......................................................................................................................9-37<br />
Table 9-15 Fugitive PM Emissions During Facility Operation (beginning in 2012).......................9-41<br />
Table 9-16 Maximum Project Impacts - Gas Firing in Combustion Turbines.................................9-46<br />
Table 9-17 Maximum Project Impacts - ULSD Firing in Combustion Turbines.............................9-46<br />
Table 9-18 Maximum Project Impacts.............................................................................................9-47<br />
Table 9-19 Maximum Project Impacts -- Comparison to SMCs......................................................9-48<br />
Table 9-20A Cumulative PM10 Modeling Results for PSD/Large Source Inventory and Project.....9-49<br />
Table 9-20B Compliance with PM10 PSD <strong>Inc</strong>rements and NAAQS<br />
(PSD/Large Source Inventory) ......................................................................................9-49<br />
Table 9-21 Comparison of Maximum Predicted Concentrations of Pollutants to Vegetation<br />
Screening Concentrations ..............................................................................................9-51<br />
Table 9-22 Catskills State Park -- High Peaks .................................................................................9-52<br />
Table 9-23 VISCREEN Maximum Catskills State Park Class II Visual Impacts1..........................9-54<br />
Table 9-24 VISCREEN Maximum Class I Visual Impacts – Brigantine Wilderness Area1...........9-56<br />
Table 9-25 VISCREEN Maximum Class I Visual Impacts – Lye Brook Wilderness Area1 ..........9-56<br />
Table 9-26 Project PM 2.5 Impacts.....................................................................................................9-60<br />
Table 9-27 Source Specific Acidic Deposition Impacts...................................................................9-64<br />
Table 9-28A Non-Criteria Pollutant Impacts and NYSDEC Guideline Concentrations ....................9-67<br />
Table 9-28B Non-Criteria Pollutant Impacts (for Turbine Startup) and NYSDEC Short-term<br />
Guideline Concentrations ..............................................................................................9-70<br />
Table 9-29 CPV Valley Visible Plume Analysis Summary.............................................................9-75<br />
Table 9-30A Cumulative PM10 Modeling Results for Local Source Inventory and Project .............9-77<br />
Table 9-30B Cumulative Local PM 10 Impacts -- Compliance with NAAQS ....................................9-77<br />
Table 9-31 Maximum Impacts at Sensitive Receptors.....................................................................9-78<br />
Table 9-32 New York State—CO 2 Emission Inventory by Sector (MMTCE) ................................9-85<br />
Table 9-33 United States CO 2 Emission Inventory by Sector (MMTCE) .......................................9-85<br />
Table 10-1 Measured Ambient Noise Level Data (dBA).................................................................10-4<br />
Table 10-2 Noise Levels of Major Construction Equipment ...........................................................10-6<br />
Table 10-3 Typical Site Average Noise Levels at 50 feet by Construction Activity .......................10-6<br />
Table 10-4 Construction Noise Levels (dBA)..................................................................................10-7<br />
Table 10-5 Noise Modeling Results (dBA)......................................................................................10-8<br />
Table 11-1 Soil Unit Summary ........................................................................................................11-3<br />
Table 12-1 Preliminary Water Balance..........................................................................................12-49<br />
Table 12-2 Facility Water Use and Wastewater Generation Rates under Indicated Operating<br />
Conditions....................................................................................................................12-50<br />
Table 12-3 Projected Peak and Average Day Water Use...............................................................12-51<br />
Table 12-4 Middletown Sewage Treatment Plant Effluent............................................................12-52<br />
Table 12-5A Projected Makeup Water Quality Characteristics for Tertiary Treated Effluent .........12-54<br />
Table 12-5B Projected Wastewater Discharge Characteristics – Average Makeup<br />
Water Quality...............................................................................................................12-55<br />
Table 12-5C Projected Wastewater Discharge Characteristics – Maximum Makeup<br />
Water Quality...............................................................................................................12-56<br />
Table 12-5D Estimated Average Change in Wastewater Discharge Characteristics for the<br />
Middletown STP Outfall Under Low Flow Conditions...............................................12-57<br />
xviii<br />
Table of Contents


