Competitive Power Ventures, Inc. - Energy Highway
Competitive Power Ventures, Inc. - Energy Highway
Competitive Power Ventures, Inc. - Energy Highway

Create successful ePaper yourself
Turn your PDF publications into a flip-book with our unique Google optimized e-Paper software.
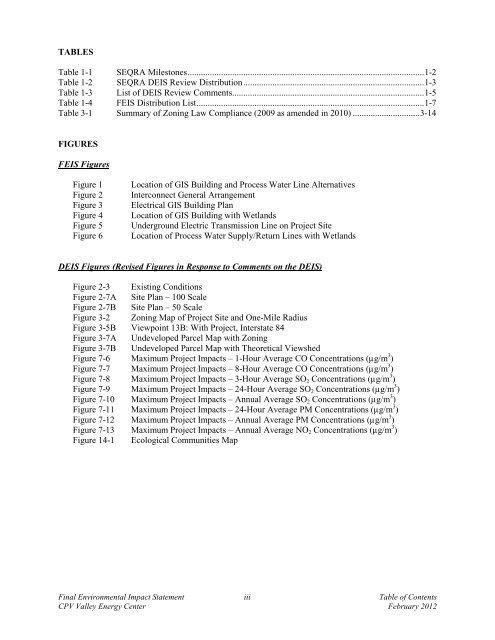
TABLES<br />
Table 1-1 SEQRA Milestones .......................................................................................................... 1-2<br />
Table 1-2 SEQRA DEIS Review Distribution ................................................................................. 1-3<br />
Table 1-3 List of DEIS Review Comments ...................................................................................... 1-5<br />
Table 1-4 FEIS Distribution List ...................................................................................................... 1-7<br />
Table 3-1 Summary of Zoning Law Compliance (2009 as amended in 2010) .............................. 3-14<br />
FIGURES<br />
FEIS Figures<br />
Figure 1<br />
Figure 2<br />
Figure 3<br />
Figure 4<br />
Figure 5<br />
Figure 6<br />
Location of GIS Building and Process Water Line Alternatives<br />
Interconnect General Arrangement<br />
Electrical GIS Building Plan<br />
Location of GIS Building with Wetlands<br />
Underground Electric Transmission Line on Project Site<br />
Location of Process Water Supply/Return Lines with Wetlands<br />
DEIS Figures (Revised Figures in Response to Comments on the DEIS)<br />
Figure 2-3 Existing Conditions<br />
Figure 2-7A Site Plan – 100 Scale<br />
Figure 2-7B Site Plan – 50 Scale<br />
Figure 3-2 Zoning Map of Project Site and One-Mile Radius<br />
Figure 3-5B Viewpoint 13B: With Project, Interstate 84<br />
Figure 3-7A Undeveloped Parcel Map with Zoning<br />
Figure 3-7B Undeveloped Parcel Map with Theoretical Viewshed<br />
Figure 7-6 Maximum Project Impacts – 1-Hour Average CO Concentrations (µg/m 3 )<br />
Figure 7-7 Maximum Project Impacts – 8-Hour Average CO Concentrations (µg/m 3 )<br />
Figure 7-8 Maximum Project Impacts – 3-Hour Average SO 2 Concentrations (µg/m 3 )<br />
Figure 7-9 Maximum Project Impacts – 24-Hour Average SO 2 Concentrations (µg/m 3 )<br />
Figure 7-10 Maximum Project Impacts – Annual Average SO 2 Concentrations (µg/m 3 )<br />
Figure 7-11 Maximum Project Impacts – 24-Hour Average PM Concentrations (µg/m 3 )<br />
Figure 7-12 Maximum Project Impacts – Annual Average PM Concentrations (µg/m 3 )<br />
Figure 7-13 Maximum Project Impacts – Annual Average NO 2 Concentrations (µg/m 3 )<br />
Figure 14-1 Ecological Communities Map<br />
Final Environmental Impact Statement iii Table of Contents<br />
CPV Valley <strong>Energy</strong> Center February 2012