SETP No. 14 The Economic Value of Incremental Employment in the ...
SETP No. 14 The Economic Value of Incremental Employment in the ...
SETP No. 14 The Economic Value of Incremental Employment in the ...

You also want an ePaper? Increase the reach of your titles
YUMPU automatically turns print PDFs into web optimized ePapers that Google loves.
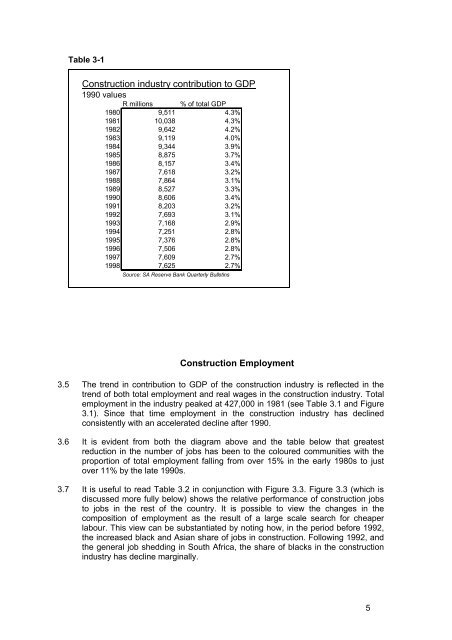
Table 3-1<br />
Construction <strong>in</strong>dustry contribution to GDP<br />
1990 values<br />
R millions % <strong>of</strong> total GDP<br />
1980 9,511 4.3%<br />
1981 10,038 4.3%<br />
1982 9,642 4.2%<br />
1983 9,119 4.0%<br />
1984 9,344 3.9%<br />
1985 8,875 3.7%<br />
1986 8,157 3.4%<br />
1987 7,618 3.2%<br />
1988 7,864 3.1%<br />
1989 8,527 3.3%<br />
1990 8,606 3.4%<br />
1991 8,203 3.2%<br />
1992 7,693 3.1%<br />
1993 7,168 2.9%<br />
1994 7,251 2.8%<br />
1995 7,376 2.8%<br />
1996 7,506 2.8%<br />
1997 7,609 2.7%<br />
1998 7,625 2.7%<br />
Source: SA Reserve Bank Quarterly Bullet<strong>in</strong>s<br />
Construction <strong>Employment</strong><br />
3.5 <strong>The</strong> trend <strong>in</strong> contribution to GDP <strong>of</strong> <strong>the</strong> construction <strong>in</strong>dustry is reflected <strong>in</strong> <strong>the</strong><br />
trend <strong>of</strong> both total employment and real wages <strong>in</strong> <strong>the</strong> construction <strong>in</strong>dustry. Total<br />
employment <strong>in</strong> <strong>the</strong> <strong>in</strong>dustry peaked at 427,000 <strong>in</strong> 1981 (see Table 3.1 and Figure<br />
3.1). S<strong>in</strong>ce that time employment <strong>in</strong> <strong>the</strong> construction <strong>in</strong>dustry has decl<strong>in</strong>ed<br />
consistently with an accelerated decl<strong>in</strong>e after 1990.<br />
3.6 It is evident from both <strong>the</strong> diagram above and <strong>the</strong> table below that greatest<br />
reduction <strong>in</strong> <strong>the</strong> number <strong>of</strong> jobs has been to <strong>the</strong> coloured communities with <strong>the</strong><br />
proportion <strong>of</strong> total employment fall<strong>in</strong>g from over 15% <strong>in</strong> <strong>the</strong> early 1980s to just<br />
over 11% by <strong>the</strong> late 1990s.<br />
3.7 It is useful to read Table 3.2 <strong>in</strong> conjunction with Figure 3.3. Figure 3.3 (which is<br />
discussed more fully below) shows <strong>the</strong> relative performance <strong>of</strong> construction jobs<br />
to jobs <strong>in</strong> <strong>the</strong> rest <strong>of</strong> <strong>the</strong> country. It is possible to view <strong>the</strong> changes <strong>in</strong> <strong>the</strong><br />
composition <strong>of</strong> employment as <strong>the</strong> result <strong>of</strong> a large scale search for cheaper<br />
labour. This view can be substantiated by not<strong>in</strong>g how, <strong>in</strong> <strong>the</strong> period before 1992,<br />
<strong>the</strong> <strong>in</strong>creased black and Asian share <strong>of</strong> jobs <strong>in</strong> construction. Follow<strong>in</strong>g 1992, and<br />
<strong>the</strong> general job shedd<strong>in</strong>g <strong>in</strong> South Africa, <strong>the</strong> share <strong>of</strong> blacks <strong>in</strong> <strong>the</strong> construction<br />
<strong>in</strong>dustry has decl<strong>in</strong>e marg<strong>in</strong>ally.<br />
5