SETP No. 14 The Economic Value of Incremental Employment in the ...
SETP No. 14 The Economic Value of Incremental Employment in the ...
SETP No. 14 The Economic Value of Incremental Employment in the ...

You also want an ePaper? Increase the reach of your titles
YUMPU automatically turns print PDFs into web optimized ePapers that Google loves.
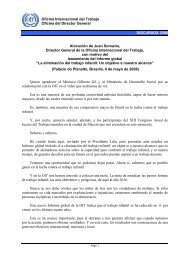
Figure 3-7<br />
1997 October Household Survey<br />
Average Annual Salaries paid by Size <strong>of</strong> Firm<br />
2000 values<br />
1000 +<br />
500 -999<br />
400 -499<br />
Number <strong>of</strong> employees <strong>in</strong> Firm<br />
300 -399<br />
200 -299<br />
100 -199<br />
50 -99<br />
20 -49<br />
Civil Eng<strong>in</strong>eer<strong>in</strong>g<br />
Construction ex. Civil<br />
10 -19<br />
5 -9<br />
- 5,000 10,000 15,000 20,000 25,000 30,000 35,000 40,000<br />
Average annual salary<br />
3.20 <strong>The</strong> October Household Surveys are very detailed surveys that are capable <strong>of</strong><br />
provid<strong>in</strong>g a wealth <strong>of</strong> <strong>in</strong>formation. <strong>The</strong> Surveys allow people to very clearly<br />
identify <strong>the</strong> k<strong>in</strong>d <strong>of</strong> work that <strong>the</strong>y do and <strong>the</strong> k<strong>in</strong>d <strong>of</strong> <strong>in</strong>dustry where <strong>the</strong> work is<br />
undertaken. Of relevance to this study, Table 3.5 illustrates <strong>the</strong> level <strong>of</strong> detail to<br />
which work <strong>in</strong> <strong>the</strong> construction <strong>in</strong>dustry can be categorised.<br />
3.21 <strong>The</strong> different work categories <strong>in</strong> Table 3.5 have been aggregated <strong>in</strong>to five general<br />
def<strong>in</strong>itions: bricklayers, concrete workers, carpenters, construction labour, semiskilled<br />
construction labour, as shown by <strong>the</strong> group<strong>in</strong>gs <strong>in</strong> <strong>the</strong> table.. Average<br />
wages paid to each <strong>of</strong> <strong>the</strong> skill categories were calculated. Much to our<br />
consternation <strong>the</strong> results were counter<strong>in</strong>tuitive. <strong>The</strong> results showed improbably<br />
low wages and an <strong>in</strong>verse relationship between skill levels and wages. In order to<br />
address this problem <strong>the</strong> f<strong>in</strong>al calculations are based on <strong>the</strong> hourly rate worked<br />
for <strong>the</strong> past seven days and are reported <strong>in</strong> Table 3.6 below. <strong>The</strong> table reports on<br />
<strong>the</strong> mean and standard deviation for <strong>the</strong> n<strong>in</strong>e prov<strong>in</strong>ces and for <strong>the</strong> nation as a<br />
whole.<br />
3.22 It will be immediately apparent that a similar (although less pronounced) <strong>in</strong>verse<br />
relationship exists between skills and remuneration. In <strong>the</strong> ‘Total’ column, for<br />
example, bricklayers earned an average R3.7 an hour (<strong>in</strong> 1997) while concrete<br />
workers earned R3.2, carpenters R6.1, construction labour R5.2 and semi-skilled<br />
labour R3.7. Intuitively one would expect bricklayers and semi-skilled labour to<br />
earn more than labour.<br />
12