SETP No. 14 The Economic Value of Incremental Employment in the ...
SETP No. 14 The Economic Value of Incremental Employment in the ...
SETP No. 14 The Economic Value of Incremental Employment in the ...

You also want an ePaper? Increase the reach of your titles
YUMPU automatically turns print PDFs into web optimized ePapers that Google loves.
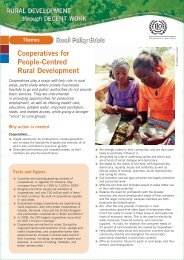
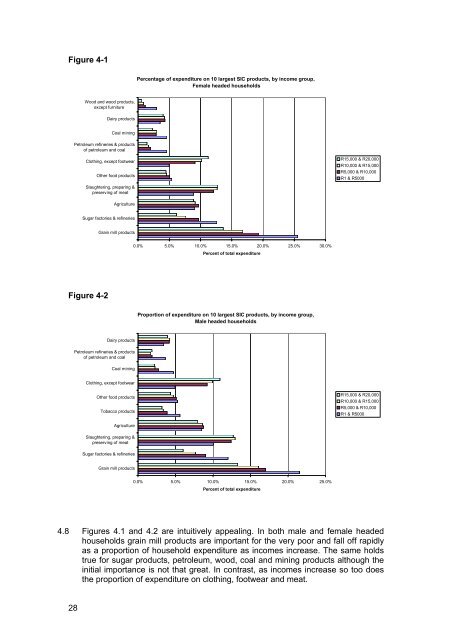
Figure 4-1<br />
Percentage <strong>of</strong> expenditure on 10 largest SIC products, by <strong>in</strong>come group,<br />
Female headed households<br />
Wood and wood products,<br />
except furniture<br />
Dairy products<br />
Coal m<strong>in</strong><strong>in</strong>g<br />
Petroleum ref<strong>in</strong>eries & products<br />
<strong>of</strong> petroleum and coal<br />
Cloth<strong>in</strong>g, except footwear<br />
O<strong>the</strong>r food products<br />
Slaughter<strong>in</strong>g, prepar<strong>in</strong>g &<br />
preserv<strong>in</strong>g <strong>of</strong> meat<br />
R15,000 & R20,000<br />
R10,000 & R15,000<br />
R5,000 & R10,000<br />
R1 & R5000<br />
Agriculture<br />
Sugar factories & ref<strong>in</strong>eries<br />
Gra<strong>in</strong> mill products<br />
0.0% 5.0% 10.0% 15.0% 20.0% 25.0% 30.0%<br />
Percent <strong>of</strong> total expenditure<br />
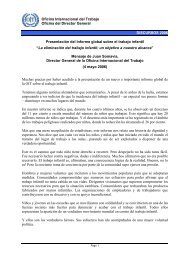
Figure 4-2<br />
Proportion <strong>of</strong> expenditure on 10 largest SIC products, by <strong>in</strong>come group,<br />
Male headed households<br />
Dairy products<br />
Petroleum ref<strong>in</strong>eries & products<br />
<strong>of</strong> petroleum and coal<br />
Coal m<strong>in</strong><strong>in</strong>g<br />
Cloth<strong>in</strong>g, except footwear<br />
O<strong>the</strong>r food products<br />
Tobacco products<br />
R15,000 & R20,000<br />
R10,000 & R15,000<br />
R5,000 & R10,000<br />
R1 & R5000<br />
Agriculture<br />
Slaughter<strong>in</strong>g, prepar<strong>in</strong>g &<br />
preserv<strong>in</strong>g <strong>of</strong> meat<br />
Sugar factories & ref<strong>in</strong>eries<br />
Gra<strong>in</strong> mill products<br />
0.0% 5.0% 10.0% 15.0% 20.0% 25.0%<br />
Percent <strong>of</strong> total expenditure<br />
4.8 Figures 4.1 and 4.2 are <strong>in</strong>tuitively appeal<strong>in</strong>g. In both male and female headed<br />
households gra<strong>in</strong> mill products are important for <strong>the</strong> very poor and fall <strong>of</strong>f rapidly<br />
as a proportion <strong>of</strong> household expenditure as <strong>in</strong>comes <strong>in</strong>crease. <strong>The</strong> same holds<br />
true for sugar products, petroleum, wood, coal and m<strong>in</strong><strong>in</strong>g products although <strong>the</strong><br />
<strong>in</strong>itial importance is not that great. In contrast, as <strong>in</strong>comes <strong>in</strong>crease so too does<br />
<strong>the</strong> proportion <strong>of</strong> expenditure on cloth<strong>in</strong>g, footwear and meat.<br />
28