SETP No. 14 The Economic Value of Incremental Employment in the ...
SETP No. 14 The Economic Value of Incremental Employment in the ...
SETP No. 14 The Economic Value of Incremental Employment in the ...
You also want an ePaper? Increase the reach of your titles
YUMPU automatically turns print PDFs into web optimized ePapers that Google loves.
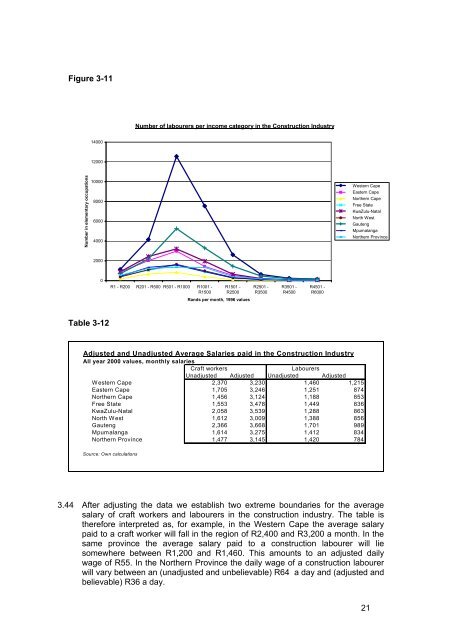
Figure 3-11<br />
Number <strong>of</strong> labourers per <strong>in</strong>come category <strong>in</strong> <strong>the</strong> Construction Industry<br />
<strong>14</strong>000<br />
12000<br />
Number <strong>in</strong> elementary occupations<br />
10000<br />
8000<br />
6000<br />
4000<br />
Western Cape<br />
Eastern Cape<br />
<strong>No</strong>r<strong>the</strong>rn Cape<br />
Free State<br />
KwaZulu-Natal<br />
<strong>No</strong>rth West<br />
Gauteng<br />
Mpumalanga<br />
<strong>No</strong>r<strong>the</strong>rn Prov<strong>in</strong>ce<br />
2000<br />
0<br />
R1 - R200 R201 - R500 R501 - R1000 R1001 -<br />
R1500<br />
R1501 -<br />
R2500<br />
R2501 -<br />
R3500<br />
R3501 -<br />
R4500<br />
R4501 -<br />
R6000<br />
Rands per month, 1996 values<br />
Table 3-12<br />
Adjusted and Unadjusted Average Salaries paid <strong>in</strong> <strong>the</strong> Construction Industry<br />
All year 2000 values, monthly salaries<br />
Craft workers<br />
Labourers<br />
Unadjusted Adjusted Unadjusted Adjusted<br />
Western Cape 2,370 3,230 1,460 1,215<br />
Eastern Cape 1,705 3,246 1,251 874<br />
<strong>No</strong>r<strong>the</strong>rn Cape 1,456 3,124 1,188 853<br />
Free State 1,553 3,478 1,449 836<br />
KwaZulu-Natal 2,058 3,539 1,288 863<br />
<strong>No</strong>rth West 1,612 3,009 1,388 856<br />
Gauteng 2,366 3,668 1,701 989<br />
Mpumalanga 1,6<strong>14</strong> 3,275 1,412 834<br />
<strong>No</strong>r<strong>the</strong>rn Prov<strong>in</strong>ce 1,477 3,<strong>14</strong>5 1,420 784<br />
Source: Own calculations<br />
3.44 After adjust<strong>in</strong>g <strong>the</strong> data we establish two extreme boundaries for <strong>the</strong> average<br />
salary <strong>of</strong> craft workers and labourers <strong>in</strong> <strong>the</strong> construction <strong>in</strong>dustry. <strong>The</strong> table is<br />
<strong>the</strong>refore <strong>in</strong>terpreted as, for example, <strong>in</strong> <strong>the</strong> Western Cape <strong>the</strong> average salary<br />
paid to a craft worker will fall <strong>in</strong> <strong>the</strong> region <strong>of</strong> R2,400 and R3,200 a month. In <strong>the</strong><br />
same prov<strong>in</strong>ce <strong>the</strong> average salary paid to a construction labourer will lie<br />
somewhere between R1,200 and R1,460. This amounts to an adjusted daily<br />
wage <strong>of</strong> R55. In <strong>the</strong> <strong>No</strong>r<strong>the</strong>rn Prov<strong>in</strong>ce <strong>the</strong> daily wage <strong>of</strong> a construction labourer<br />
will vary between an (unadjusted and unbelievable) R64 a day and (adjusted and<br />
believable) R36 a day.<br />
21


