FY 2013 Proposed Budget Book - Home | Orange County Gov FL
FY 2013 Proposed Budget Book - Home | Orange County Gov FL
FY 2013 Proposed Budget Book - Home | Orange County Gov FL

Create successful ePaper yourself
Turn your PDF publications into a flip-book with our unique Google optimized e-Paper software.
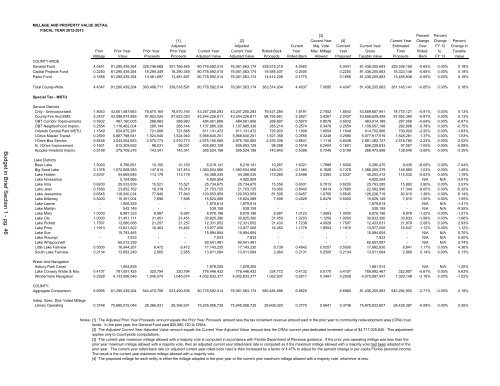
MILLAGE AND PROPERTY VALUE DETAIL<br />
FISCAL YEAR 2012-<strong>2013</strong><br />
[3] Percent Percent<br />
[1] [2] Current Year [4] Current Year Change Change Percent<br />
Adjusted Adjusted Current Maj. Vote Currrent Current Year Estimated Over <strong>FY</strong> 12 Change in<br />
Prior Prior Year Prior Year Prior Year Current Year Current Year Rolled-Back Year Max. Millage Year Gross Final Rolled- to Taxable<br />
Millage Value Proceeds Proceeds Adjusted Value Adjusted Value Proceeds Rolled-Back Allowed <strong>Proposed</strong> Taxable Value Proceeds Back <strong>FY</strong> 13 Value<br />
COUNTY-WIDE<br />
General Fund 4.0441 81,290,439,264 328,746,665 307,766,545 80,778,592,014 76,061,563,174 329,515,319 4.0463 4.0441 81,436,205,683 329,336,159 -0.65% 0.00% 0.18%<br />
Capital Projects Fund 0.2250 81,290,439,264 18,290,349 18,290,349 80,778,592,014 76,061,563,174 19,585,407 0.2405 0.2250 81,436,205,683 18,323,146 -0.65% 0.00% 0.18%<br />
Parks Fund 0.1656 81,290,439,264 13,461,697 13,461,697 80,778,592,014 76,061,563,174 14,414,208 0.1770 0.1656 81,436,205,683 13,485,836 -0.65% 0.00% 0.18%<br />
Total <strong>County</strong>-Wide 4.4347 81,290,439,264 360,498,711 339,518,591 80,778,592,014 76,061,563,174 363,514,934 4.4637 7.0695 4.4347 81,436,205,683 361,145,141 -0.65% 0.00% 0.18%<br />
Special Tax - MSTU<br />
<strong>Budget</strong> in Brief Section 1 - pg. 46<br />
Service Districts<br />
Cnty - Unincorporated 1.8043 43,601,487,663 78,670,164 78,670,164 43,247,255,293 43,247,255,293 79,421,284 1.8191 2.7552 1.8043 43,659,657,941 78,775,121 -0.81% 0.00% 0.13%<br />
<strong>County</strong> Fire And EMS 2.2437 43,598,974,885 97,823,020 97,823,020 43,244,226,811 43,244,226,811 98,755,661 2.2621 3.4267 2.2437 43,656,629,459 97,952,380 -0.81% 0.00% 0.13%<br />
OBT Corridor Improvements 0.5932 487,160,005 288,983 288,983 484,061,806 484,061,806 288,897 0.5970 0.8078 0.5932 483,914,189 287,058 -0.64% 0.00% -0.67%<br />
OBT Neighborhood Improv. 0.2554 1,116,462,004 285,144 285,144 1,107,985,336 1,107,985,336 285,214 0.2574 0.3478 0.2554 1,108,057,198 282,998 -0.78% 0.00% -0.75%<br />
Orlando Central Park MSTU 1.1549 624,875,281 721,668 721,668 611,131,472 611,131,472 725,903 1.1809 1.6054 1.1549 614,702,966 709,920 -2.20% 0.00% -1.63%<br />
I-Drive Master Transit 0.2590 5,887,798,541 1,524,940 1,524,940 5,968,640,251 5,968,640,251 1,527,358 0.2555 0.3248 0.2590 5,977,917,519 1,548,281 1.37% 0.00% 1.53%<br />
I-Drive Bus Service 0.8448 3,043,054,653 2,570,773 2,570,773 2,975,150,565 2,975,150,565 2,576,308 0.8641 1.1116 0.8448 2,981,492,727 2,518,765 -2.23% 0.00% -2.02%<br />
N. I-Drive Improvement 0.1601 612,309,652 98,031 98,031 605,893,129 605,893,129 98,088 0.1618 0.2404 0.1601 606,229,633 97,057 -1.05% 0.00% -0.99%<br />
Apopka-Vineland Improv. 0.5199 275,709,276 143,341 143,341 265,524,156 265,524,156 143,843 0.5398 0.7245 0.5199 266,473,898 138,540 -3.69% 0.00% -3.35%<br />
Lake Districts<br />
Bass Lake 1.5000 6,766,851 10,150 10,150 6,219,141 6,219,141 10,267 1.6321 1.7888 1.5000 6,290,475 9,436 -8.09% 0.00% -7.04%<br />
Big Sand Lake 0.1378 1,072,668,583 147,814 147,814 1,083,504,566 1,083,504,566 148,431 0.1364 0.1926 0.1378 1,088,205,379 149,955 1.03% 0.00% 1.45%<br />
Lake Holden 2.5337 44,669,646 113,179 113,179 44,388,035 44,388,035 115,260 2.5498 3.3393 2.5337 45,203,412 114,532 -0.63% 0.00% 1.19%<br />
Lake Horseshoe - 5,104,966 - - 4,920,554 4,920,554 - - - - 4,925,554 - N/A N/A -3.51%<br />
Lake Irma 0.6200 25,033,839 15,521 15,521 25,734,675 25,734,675 15,556 0.6031 0.7813 0.6200 25,793,285 15,992 2.80% 0.00% 3.03%<br />
Lake Jean 0.7680 23,852,762 18,319 18,319 21,703,725 21,703,725 19,060 0.8440 1.8414 0.7680 22,582,996 17,344 -9.00% 0.00% -5.32%<br />
Lake Jessamine 0.6545 118,930,014 77,840 77,840 120,553,959 120,553,959 81,505 0.6457 1.0765 0.6545 126,226,719 82,615 1.36% 0.00% 6.14%<br />
Lake Killarney 0.5000 15,391,004 7,696 7,696 15,624,089 15,624,089 7,699 0.4926 0.6476 0.5000 15,629,149 7,815 1.50% 0.00% 1.55%<br />
Lake Lawne - 1,906,529 - - 1,879,614 1,879,614 - - - - 1,879,614 - N/A N/A -1.41%<br />
Lake Marilyn - 542,149 - - 539,159 539,159 - - - - 539,159 - N/A N/A -0.55%<br />
Lake Mary 1.0000 8,987,333 8,987 8,987 8,878,196 8,878,196 8,987 1.0123 1.2683 1.0000 8,878,196 8,878 -1.22% 0.00% -1.21%<br />
Lake Ola 1.0000 31,451,111 31,451 31,451 30,825,390 30,825,390 31,459 1.0203 1.1259 1.0000 30,833,390 30,833 -1.99% 0.00% -1.96%<br />
Lake Pickett 1.7597 12,080,066 21,257 21,257 12,331,652 12,331,652 21,433 1.7238 4.0928 1.7597 12,433,631 21,879 2.08% 0.00% 2.93%<br />
Lake Price 1.1910 13,821,822 16,462 16,462 13,977,006 13,977,006 16,462 1.1778 1.9554 1.1910 13,977,006 16,647 1.12% 0.00% 1.12%<br />
Lake Sue - 15,783,465 - - 15,894,654 15,894,654 - - - - 15,894,654 - N/A N/A 0.70%<br />
Lake Waumpi - 7,833 - - 7,833 7,833 - - - - 7,833 - N/A N/A 0.00%<br />
Lake Whippoorwill - 60,512,259 - - 60,541,481 60,541,481 - - - - 60,957,087 - N/A N/A 0.74%<br />
Little Lake Fairview 0.5000 16,944,267 8,472 8,472 17,143,235 17,143,235 8,739 0.4942 0.5257 0.5000 17,682,830 8,841 1.17% 0.00% 4.36%<br />
South Lake Fairview 0.2134 13,893,249 2,965 2,965 13,911,084 13,911,084 2,964 0.2131 0.2505 0.2134 13,911,084 2,969 0.14% 0.00% 0.13%<br />
Water And Navigation<br />
Asbury Park Canal - 1,904,839 - - 1,878,205 1,878,205 - - - - 1,881,914 - N/A N/A -1.20%<br />
Lake Conway Water & Nav. 0.4107 781,091,425 320,794 320,794 776,446,432 776,446,432 324,772 0.4132 0.5170 0.4107 785,992,467 322,807 -0.61% 0.00% 0.63%<br />
Windermere Navigation 0.2528 4,133,996,546 1,045,074 1,045,074 4,002,833,377 4,002,833,377 1,062,937 0.2611 0.3497 0.2528 4,070,997,047 1,029,148 -3.18% 0.00% -1.52%<br />
COUNTY:<br />
Aggregate Comparison 6.6995 81,290,439,264 544,470,756 523,490,636 80,778,592,014 76,061,563,174 560,484,686 6.8825 6.6960 81,436,205,683 545,294,952 -2.71% -0.05% 0.18%<br />
Indep. Spec. Dist.-Voted Millage<br />
Library Operating 0.3748 75,685,515,046 28,366,931 28,366,931 75,245,056,735 75,245,056,735 28,606,320 0.3770 0.5641 0.3748 75,878,833,607 28,439,387 -0.58% 0.00% 0.26%<br />
Notes: [1] The Adjusted Prior Year Proceeds amount equals the Prior Year Proceeds amount less the tax increment revenue amount paid in the prior year to community redevelopment area (CRA) trust<br />
funds. In the prior year, the General Fund paid $20,980,120 to CRAs.<br />
[2] The Adjusted Current Year Adjusted Value amount equals the Current Year Adjusted Value amount less the CRAs' current year dedicated increment value of $4,717,028,840. This adjustment<br />
applies only to <strong>County</strong>wide computations.<br />
[3] The current year maximum millage allowed with a majority vote is computed in accordance with Florida Department of Revenue guidance. If the prior year operating millage was less than the<br />
prior year maximum millage allowed with a majority vote, then an adjusted current year rolled-back rate is computed as if the maximum millage allowed with a majority vote had been adopted in the<br />
prior year. The current year rolled-back rate (or adjusted current year rolled-back rate) is then increased by a factor of 4.47% to adjust for the percent change in per capita Florida personal income.<br />
The result is the current year maximum millage allowed with a majority vote.<br />
[4] The proposed millage for each entity is either the millage adopted in the prior year or the current year maximum millage allowed with a majority vote, whichever is less.