Arrow Prospectus - PGS
Arrow Prospectus - PGS
Arrow Prospectus - PGS
You also want an ePaper? Increase the reach of your titles
YUMPU automatically turns print PDFs into web optimized ePapers that Google loves.
ARROW SEISMIC ASA – INITIAL PUBLIC OFFERING<br />
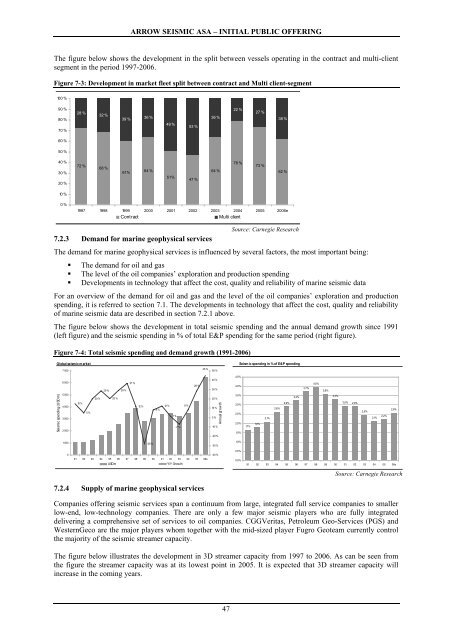
The figure below shows the development in the split between vessels operating in the contract and multi-client<br />
segment in the period 1997-2006.<br />
Figure 7-3: Development in market fleet split between contract and Multi client-segment<br />
100 %<br />
90 %<br />
80 %<br />
70 %<br />
28 %<br />
32 %<br />
39 %<br />
36 %<br />
49 %<br />
53 %<br />
36 %<br />
22 %<br />
27 %<br />
38 %<br />
60 %<br />
50 %<br />
40 %<br />
30 %<br />
20 %<br />
72 %<br />
68 %<br />
61 %<br />
64 %<br />
51 %<br />
47 %<br />
64 %<br />
78 %<br />
73 %<br />
62 %<br />
10 %<br />
0 %<br />
1997 1998 1999 2000 2001 2002 2003 2004 2005 2006e<br />
Contract<br />
Multi client<br />
7.2.3 Demand for marine geophysical services<br />
The demand for marine geophysical services is influenced by several factors, the most important being:<br />
• The demand for oil and gas<br />
• The level of the oil companies’ exploration and production spending<br />
• Developments in technology that affect the cost, quality and reliability of marine seismic data<br />
For an overview of the demand for oil and gas and the level of the oil companies’ exploration and production<br />
spending, it is referred to section 7.1. The developments in technology that affect the cost, quality and reliability<br />
of marine seismic data are described in section 7.2.1 above.<br />
The figure below shows the development in total seismic spending and the annual demand growth since 1991<br />
(left figure) and the seismic spending in % of total E&P spending for the same period (right figure).<br />
Figure 7-4: Total seismic spending and demand growth (1991-2006)<br />
Source: Carnegie Research<br />
Global seismic m arket<br />
Seism ic spending in % of E&P spending<br />
7 000<br />
45 %<br />
50 %<br />
6 000<br />
29 %<br />
29 %<br />
37 %<br />
28 %<br />
40 %<br />
30 %<br />
4,5%<br />
4,0%<br />
3,7%<br />
4,0%<br />
3,6%<br />
Seismic spending (USDm)<br />
5 000<br />
4 000<br />
3 000<br />
2 000<br />
15 %<br />
5 %<br />
20 %<br />
20 %<br />
12 %<br />
8 %<br />
12 %<br />
1 %<br />
-7 %<br />
8 %<br />
20 %<br />
10 %<br />
0 %<br />
-10 %<br />
-20 %<br />
Annual growth<br />
3,5%<br />
3,0%<br />
2,5%<br />
2,0%<br />
1,5%<br />
1,7%<br />
1,8%<br />
2,1%<br />
2,6%<br />
2,9%<br />
3,2%<br />
3,3%<br />
3,0% 2,9%<br />
2,5%<br />
2,1% 2,2% 2,6%<br />
1 000<br />
-28 %<br />
-30 %<br />
1,0%<br />
0,5%<br />
0<br />
-40 %<br />
91 92 93 94 95 96 97 98 99 00 01 02 03 04 05 06e<br />
USDm<br />
Y/Y Growth<br />
0,0%<br />
91 92 93 94 95 96 97 98 99 00 01 02 03 04 05 06e<br />
Source: Carnegie Research<br />
7.2.4 Supply of marine geophysical services<br />
Companies offering seismic services span a continuum from large, integrated full service companies to smaller<br />
low-end, low-technology companies. There are only a few major seismic players who are fully integrated<br />
delivering a comprehensive set of services to oil companies. CGGVeritas, Petroleum Geo-Services (<strong>PGS</strong>) and<br />
WesternGeco are the major players whom together with the mid-sized player Fugro Geoteam currently control<br />
the majority of the seismic streamer capacity.<br />
The figure below illustrates the development in 3D streamer capacity from 1997 to 2006. As can be seen from<br />
the figure the streamer capacity was at its lowest point in 2005. It is expected that 3D streamer capacity will<br />
increase in the coming years.<br />
47


