

Chapter 2: Graphs, Charts, and Tables--Describing Your Data
Chapter 2: Graphs, Charts, and Tables--Describing Your Data
Chapter 2: Graphs, Charts, and Tables--Describing Your Data

You also want an ePaper? Increase the reach of your titles
YUMPU automatically turns print PDFs into web optimized ePapers that Google loves.
46 CHAPTER 2 • GRAPHS, CHARTS, AND TABLES—DESCRIBING YOUR DATA<br />
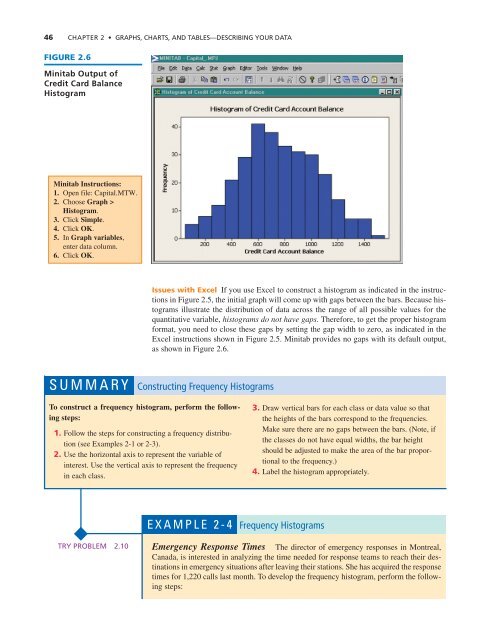
FIGURE 2.6<br />
Minitab Output of<br />
Credit Card Balance<br />
Histogram<br />
Minitab Instructions:<br />
1. Open file: Capital.MTW.<br />
2. Choose Graph ><br />
Histogram.<br />
3. Click Simple.<br />
4. Click OK.<br />
5. In Graph variables,<br />
enter data column.<br />
6. Click OK.<br />
Issues with Excel If you use Excel to construct a histogram as indicated in the instructions<br />
in Figure 2.5, the initial graph will come up with gaps between the bars. Because histograms<br />
illustrate the distribution of data across the range of all possible values for the<br />
quantitative variable, histograms do not have gaps. Therefore, to get the proper histogram<br />
format, you need to close these gaps by setting the gap width to zero, as indicated in the<br />
Excel instructions shown in Figure 2.5. Minitab provides no gaps with its default output,<br />
as shown in Figure 2.6.<br />
SUMMARY Constructing Frequency Histograms<br />
To construct a frequency histogram, perform the following<br />
steps:<br />
1. Follow the steps for constructing a frequency distribution<br />
(see Examples 2-1 or 2-3).<br />
2. Use the horizontal axis to represent the variable of<br />
interest. Use the vertical axis to represent the frequency<br />
in each class.<br />
3. Draw vertical bars for each class or data value so that<br />
the heights of the bars correspond to the frequencies.<br />
Make sure there are no gaps between the bars. (Note, if<br />
the classes do not have equal widths, the bar height<br />
should be adjusted to make the area of the bar proportional<br />
to the frequency.)<br />
4. Label the histogram appropriately.<br />
EXAMPLE 2-4 Frequency Histograms<br />
TRY PROBLEM 2.10<br />
Emergency Response Times The director of emergency responses in Montreal,<br />
Canada, is interested in analyzing the time needed for response teams to reach their destinations<br />
in emergency situations after leaving their stations. She has acquired the response<br />
times for 1,220 calls last month. To develop the frequency histogram, perform the following<br />
steps:


