

Chapter 2: Graphs, Charts, and Tables--Describing Your Data
Chapter 2: Graphs, Charts, and Tables--Describing Your Data
Chapter 2: Graphs, Charts, and Tables--Describing Your Data

You also want an ePaper? Increase the reach of your titles
YUMPU automatically turns print PDFs into web optimized ePapers that Google loves.
38 CHAPTER 2 • GRAPHS, CHARTS, AND TABLES—DESCRIBING YOUR DATA<br />
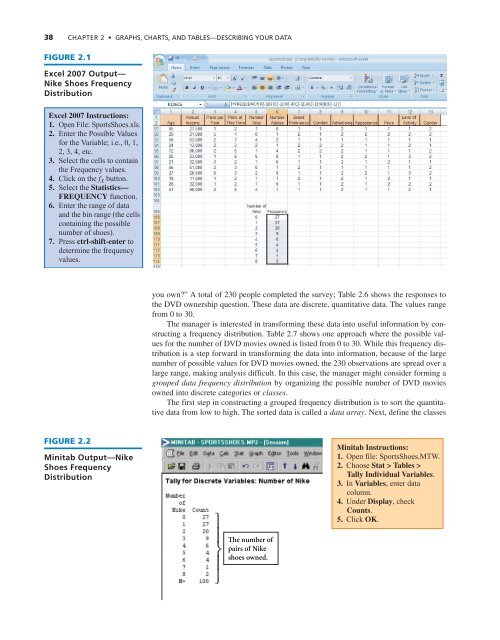
FIGURE 2.1<br />
Excel 2007 Output—<br />
Nike Shoes Frequency<br />
Distribution<br />
Excel 2007 Instructions:<br />
1. Open File: SportsShoes.xls.<br />
2. Enter the Possible Values<br />
for the Variable; i.e., 0, 1,<br />
2, 3, 4, etc.<br />
3. Select the cells to contain<br />
the Frequency values.<br />
4. Click on the fx button.<br />
5. Select the Statistics—<br />
FREQUENCY function.<br />
6. Enter the range of data<br />
<strong>and</strong> the bin range (the cells<br />
containing the possible<br />
number of shoes).<br />
7. Press ctrl-shift-enter to<br />
determine the frequency<br />
values.<br />
you own?” A total of 230 people completed the survey; Table 2.6 shows the responses to<br />
the DVD ownership question. These data are discrete, quantitative data. The values range<br />
from 0 to 30.<br />
The manager is interested in transforming these data into useful information by constructing<br />
a frequency distribution. Table 2.7 shows one approach where the possible values<br />
for the number of DVD movies owned is listed from 0 to 30. While this frequency distribution<br />
is a step forward in transforming the data into information, because of the large<br />
number of possible values for DVD movies owned, the 230 observations are spread over a<br />
large range, making analysis difficult. In this case, the manager might consider forming a<br />
grouped data frequency distribution by organizing the possible number of DVD movies<br />
owned into discrete categories or classes.<br />
The first step in constructing a grouped frequency distribution is to sort the quantitative<br />
data from low to high. The sorted data is called a data array. Next, define the classes<br />
FIGURE 2.2<br />
Minitab Output—Nike<br />
Shoes Frequency<br />
Distribution<br />
Minitab Instructions:<br />
1. Open file: SportsShoes.MTW.<br />
2. Choose Stat > <strong>Tables</strong> ><br />
Tally Individual Variables.<br />
3. In Variables, enter data<br />
column.<br />
4. Under Display, check<br />
Counts.<br />
5. Click OK.<br />
The number of<br />
pairs of Nike<br />
shoes owned.


