

Chapter 2: Graphs, Charts, and Tables--Describing Your Data
Chapter 2: Graphs, Charts, and Tables--Describing Your Data
Chapter 2: Graphs, Charts, and Tables--Describing Your Data

Create successful ePaper yourself
Turn your PDF publications into a flip-book with our unique Google optimized e-Paper software.
60 CHAPTER 2 • GRAPHS, CHARTS, AND TABLES—DESCRIBING YOUR DATA<br />
Step 1 Define the categories.<br />
<strong>Data</strong> are available for the June 24, 2005 stock price <strong>and</strong> price/earnings<br />
ratio for each of eight companies. These data are shown as follows:<br />
Company (ticker symbol) PE Ratio Stock Price<br />
Abbott Labs (ABT) 21 $49<br />
Altria Group (MO) 14 $65<br />
Coca-Cola (KO) 21 $42<br />
Colgate-Palmolive (CL) 20 $51<br />
General Mills (GIS) 17 $51<br />
Pfizer (PFE) 13 $29<br />
Proctor & Gamble (PG) 21 $53<br />
Wyeth (WYE) 15 $43<br />
The category to be displayed is the company.<br />
Step 2 Determine the appropriate measure to be displayed.<br />
The measure of interest is the price/earnings ratio.<br />
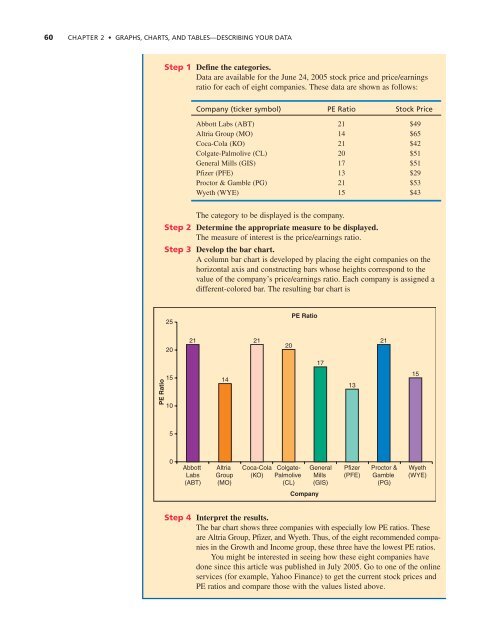
Step 3 Develop the bar chart.<br />
A column bar chart is developed by placing the eight companies on the<br />
horizontal axis <strong>and</strong> constructing bars whose heights correspond to the<br />
value of the company’s price/earnings ratio. Each company is assigned a<br />
different-colored bar. The resulting bar chart is<br />
25<br />
PE Ratio<br />
20<br />
21<br />
21<br />
20<br />
21<br />
17<br />
10<br />
PE Ratio15<br />
14<br />
13<br />
15<br />
5<br />
0<br />
Abbott<br />
Labs<br />
(ABT)<br />
Altria<br />
Group<br />
(MO)<br />
Coca-Cola<br />
(KO)<br />
Colgate-<br />
Palmolive<br />
(CL)<br />
General<br />
Mills<br />
(GIS)<br />
Pfizer<br />
(PFE)<br />
Proctor &<br />
Gamble<br />
(PG)<br />
Wyeth<br />
(WYE)<br />
Company<br />
Step 4 Interpret the results.<br />
The bar chart shows three companies with especially low PE ratios. These<br />
are Altria Group, Pfizer, <strong>and</strong> Wyeth. Thus, of the eight recommended companies<br />
in the Growth <strong>and</strong> Income group, these three have the lowest PE ratios.<br />
You might be interested in seeing how these eight companies have<br />
done since this article was published in July 2005. Go to one of the online<br />
services (for example, Yahoo Finance) to get the current stock prices <strong>and</strong><br />
PE ratios <strong>and</strong> compare those with the values listed above.


