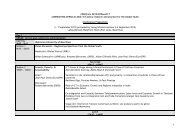
logframe 2007 - Research ICT Africa
logframe 2007 - Research ICT Africa
logframe 2007 - Research ICT Africa

Create successful ePaper yourself
Turn your PDF publications into a flip-book with our unique Google optimized e-Paper software.
11<br />
OVI<br />
number<br />
GO1.<br />
GO2.<br />
OVI formulation OVI description Source of information Responsible<br />
for data<br />
collection<br />
The development and operation of Transport<br />
Infrastructures and Services contributes at least<br />
to a total value of 10% at the average growth rate<br />
annual of GDP fixed at a minimum 7.2% over the<br />
period <strong>2007</strong> and 2011.<br />
The number of created jobs each year by the<br />
transport sector is at least 20 % over the period<br />
<strong>2007</strong> to 2011.<br />
Ratio between total<br />
added value from<br />
Transport sub sector<br />
and total GDP in<br />
percentage.<br />
Number of employees<br />
in public or private<br />
enterprises operating in<br />
Transport Sub sector<br />
BNR annual reports<br />
BNR<br />
NIS<br />
Frequency of<br />
data collection<br />
Baseline<br />
value in<br />
2006<br />
(except<br />
other given<br />
specific<br />
indication)<br />
Target value<br />
for 2011<br />
(except other<br />
given<br />
specific<br />
indication)<br />
Comment on<br />
availability of baseline<br />
value<br />
Annual 8.1 % 10 % • Data annually provided by<br />
BNR<br />
• Assumption that<br />
Transport sub sector<br />
added value should<br />
increase at least by 7%<br />
per year.<br />
MININFRA MININFRA Annual ? 20 % • Such kind of data<br />
collection has to be<br />
established in MINIFRA<br />
eventually in cooperation<br />
with MINEFOTRA