logframe 2007 - Research ICT Africa
logframe 2007 - Research ICT Africa
logframe 2007 - Research ICT Africa

Create successful ePaper yourself
Turn your PDF publications into a flip-book with our unique Google optimized e-Paper software.
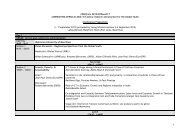
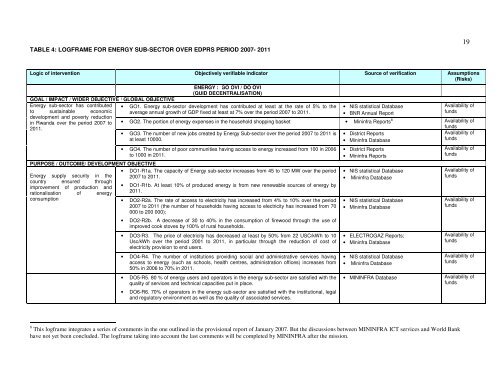
TABLE 4: LOGFRAME FOR ENERGY SUB-SECTOR OVER EDPRS PERIOD <strong>2007</strong>- 2011<br />
19<br />
Logic of intervention Objectively verifiable indicator Source of verification Assumptions<br />
(Risks)<br />
GOAL / IMPACT / WIDER OBJECTIVE / GLOBAL OBJECTIVE<br />
Energy sub-sector has contributed<br />
to sustainable economic<br />
development and poverty reduction<br />
in Rwanda over the period <strong>2007</strong> to<br />
2011.<br />
PURPOSE / OUTCOME/ DEVELOPMENT OBJECTIVE<br />
Energy supply security in the<br />
country ensured through<br />
improvement of production and<br />
rationalisation of energy<br />
consumption<br />
ENERGY : GO OVI / DO OVI<br />
(QUID DECENTRALISATION)<br />
• GO1. Energy sub-sector development has contributed at least at the rate of 5% to the<br />
average annual growth of GDP fixed at least at 7% over the period <strong>2007</strong> to 2011.<br />
• NIS statistical Database<br />
• BNR Annual Report<br />
Availability of<br />
funds<br />
• GO2. The portion of energy expenses in the household shopping basket • Mininfra Reports 8 Availability of<br />
funds<br />
• GO3. The number of new jobs created by Energy Sub-sector over the period <strong>2007</strong> to 2011 is<br />
at least 10000.<br />
• District Reports<br />
• Mininfra Database<br />
Availability of<br />
funds<br />
• GO4. The number of poor communities having access to energy increased from 100 in 2006<br />
to 1000 in 2011.<br />
• DO1-R1a. The capacity of Energy sub-sector increases from 45 to 120 MW over the period<br />
<strong>2007</strong> to 2011.<br />
• DO1-R1b. At least 10% of produced energy is from new renewable sources of energy by<br />
2011.<br />
• DO2-R2a. The rate of access to electricity has increased from 4% to 10% over the period<br />
<strong>2007</strong> to 2011 (the number of households having access to electricity has increased from 70<br />
000 to 200 000);<br />
• DO2-R2b. A decrease of 30 to 40% in the consumption of firewood through the use of<br />
improved cook stoves by 100% of rural households.<br />
• DO3-R3. The price of electricity has decreased at least by 50% from 22 USC/kWh to 10<br />
Usc/kWh over the period 2001 to 2011, in particular through the reduction of cost of<br />
electricity provision to end users.<br />
• DO4-R4. The number of institutions providing social and administrative services having<br />
access to energy (such as schools, health centres, administration offices) increases from<br />
50% in 2006 to 70% in 2011.<br />
• DO5-R5. 80 % of energy users and operators in the energy sub-sector are satisfied with the<br />
quality of services and technical capacities put in place.<br />
• DO6-R6. 70% of operators in the energy sub-sector are satisfied with the institutional, legal<br />
and regulatory environment as well as the quality of associated services.<br />
• District Reports<br />
• Mininfra Reports<br />
• NIS statistical Database<br />
• Mininfra Database<br />
• NIS statistical Database<br />
• Mininfra Database<br />
• ELECTROGAZ Reports;<br />
• Mininfra Database<br />
• NIS statistical Database<br />
• Mininfra Database<br />
• MININFRA Database<br />
Availability of<br />
funds<br />
Availability of<br />
funds<br />
Availability of<br />
funds<br />
Availability of<br />
funds<br />
Availability of<br />
funds<br />
Availability of<br />
funds<br />
8 This <strong>logframe</strong> integrates a series of comments in the one outlined in the provisional report of January <strong>2007</strong>. But the discussions between MININFRA <strong>ICT</strong> services and World Bank<br />
have not yet been concluded. The <strong>logframe</strong> taking into account the last comments will be completed by MININFRA after the mission.