logframe 2007 - Research ICT Africa
logframe 2007 - Research ICT Africa
logframe 2007 - Research ICT Africa

You also want an ePaper? Increase the reach of your titles
YUMPU automatically turns print PDFs into web optimized ePapers that Google loves.
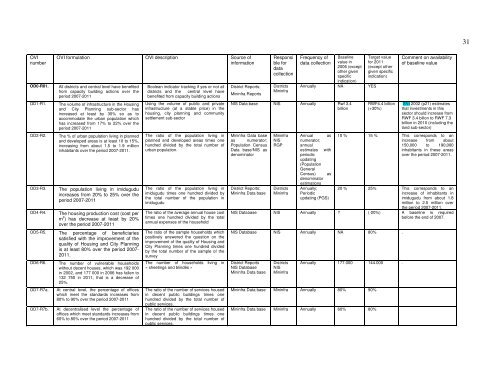
31<br />
OVI<br />
number<br />
OD0-R01.<br />
OD1-R1.<br />
OD2-R2.<br />
OD3-R3.<br />
OD4-R4.<br />
OVI formulation OVI description Source of<br />
information<br />
All districts and central level have benefited<br />
from capacity building actions over the<br />
period <strong>2007</strong>-2011<br />
The volume of infrastructure in the Housing<br />
and City Planning sub-sector has<br />
increased at least by 30% so as to<br />
accommodate the urban population which<br />
has increased from 17% to 22% over the<br />
period <strong>2007</strong>-2011<br />
The % of urban population living in planned<br />
and developed areas is at least 10 to 15%,<br />
increasing from about 1.5 to 1.9 million<br />
inhabitants over the period <strong>2007</strong>-2011.<br />
The population living in imidugudu<br />
increases from 20% to 25% over the<br />
period <strong>2007</strong>-2011<br />
The housing production cost (cost per<br />
m 2 ) has decrease at least by 20%<br />
over the period <strong>2007</strong>-2011<br />
OD5-R5. The percentage of beneficiaries<br />
satisfied with the improvement of the<br />
quality of Housing and City Planning<br />
is at least 80% over the period <strong>2007</strong>-<br />
2011.<br />
OD6-R6.<br />
OD7-R7a.<br />
OD7-R7b.<br />
The number of vulnerable households<br />
without decent houses, which was 192 000<br />
in 2002, and 177 000 in 2006 has fallen to<br />
132 750 in 2011, that is a decrease of<br />
25%.<br />
At central level, the percentage of offices<br />
which meet the standards increases from<br />
80% to 90% over the period <strong>2007</strong>-2011<br />
At decentralised level the percentage of<br />
offices which meet standards increases from<br />
60% to 80% over the period <strong>2007</strong>-2011<br />
Boolean indicator tracking if yes or not all<br />
districts and the central level have<br />
benefited from capacity building actions<br />
Using the volume of public and private<br />
infrastructure (at a stable price) in the<br />
housing, city planning and community<br />
settlement sub-sector<br />
The ratio of the population living in<br />
planned and developed areas times one<br />
hundred divided by the total number of<br />
urban population.<br />
The ratio of the population living in<br />
imidugudu times one hundred divided by<br />
the total number of the population in<br />
imidugudu<br />
The ratio of the average annual house cost<br />
times one hundred divided by the total<br />
annual expenses of the household<br />
The ratio of the sample households which<br />
positively answered the question on the<br />
improvement of the quality of Housing and<br />
City Planning times one hundred divided<br />
by the total number of the sample of the<br />
survey<br />
The number of households living in<br />
« sheetings and blindés »<br />
The ratio of the number of services housed<br />
in decent public buildings times one<br />
hundred divided by the total number of<br />
public services.<br />
The ratio of the number of services housed<br />
in decent public buildings times one<br />
hundred divided by the total number of<br />
public services.<br />
District Reports;<br />
Mininfra Reports<br />
Responsi<br />
ble for<br />
data<br />
collection<br />
Districts<br />
Mininfra<br />
Frequency of<br />
data collection<br />
Baseline<br />
value in<br />
2006 (except<br />
other given<br />
specific<br />
indication)<br />
Annually NA YES<br />
NIS Data base NIS Annually Rwf 3.4<br />
billion<br />
Mininfra Data base<br />
as numerator;<br />
Population Census<br />
Data base/NIS as<br />
denominator<br />
District Reports;<br />
Mininfra Data base<br />
Mininfra<br />
NIS<br />
RGP<br />
Districts<br />
Mininfra<br />
Annual as<br />
numerator;<br />
annual<br />
estimates with<br />
periodic<br />
updating<br />
(Population<br />
General<br />
Census) as<br />
denominator<br />
estimations<br />
Annually;<br />
Periodic<br />
updating (PGS)<br />
Target value<br />
for 2011<br />
(except other<br />
given specific<br />
indication)<br />
RWF4.4 billion<br />
(+30%)<br />
Comment on availability<br />
of baseline value<br />
SNI 2002 (p21) estimates<br />
that investments in this<br />
sector should increase from<br />
RWF 3.4 billon to RWF 7.3<br />
billion in 2010 (including the<br />
land sub-sector)<br />
10 % 15 % This corresponds to an<br />
increase from about<br />
150,000 to 190,000<br />
inhabitants in these areas<br />
over the period <strong>2007</strong>-2011.<br />
20 % 25% This corresponds to an<br />
increase of inhabitants in<br />
imidugudu from about 1.8<br />
million to 2.5 million over<br />
the period <strong>2007</strong>-2011.<br />
NIS Database NIS Annually ? (-20%) A baseline is required<br />
before the end of <strong>2007</strong>.<br />
NIS Database NIS Annually NA 80% .<br />
District Reports<br />
NIS Database<br />
Mininfra Data base<br />
Districts<br />
NIS<br />
Mininfra<br />
Annually 177.000 144.000 .<br />
Mininfra Data base Mininfra Annually 80% 90%<br />
Mininfra Data base Mininfra Annually 60% 80%