logframe 2007 - Research ICT Africa
logframe 2007 - Research ICT Africa
logframe 2007 - Research ICT Africa

You also want an ePaper? Increase the reach of your titles
YUMPU automatically turns print PDFs into web optimized ePapers that Google loves.
5<br />
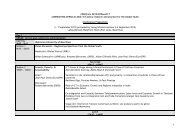
TABLE 1: GLOBAL LOGFRAME FOR MININFRA INTERVENTIONS OVER EDPRS PERIOD <strong>2007</strong>-2011 – Global objective<br />
Logic of intervention Objectively Verifiable Indicator Source of verification Assumptions (Risks)<br />
Global objective compared to<br />
EDPRS objectives: The<br />
infrastructure sector has<br />
contributed to sustainable<br />
economic development and<br />
poverty reduction in Rwanda<br />
over the period <strong>2007</strong>-2001 1.<br />
GO : 5 OVI<br />
• GO1. Infrastructure development has contributed at least at<br />
the rate of 20 % 1 to the average annual growth of GDP fixed at<br />
least at 7% over the period <strong>2007</strong> and 2011 (7 % between 2001<br />
and 2006)<br />
• GO2. Private operators’ access to infrastructure and<br />
associated services has enabled the private sector to<br />
increase its contribution to GDP from X% to 10% between<br />
<strong>2007</strong> and 2011 (forecast of 3.4% to 7% over the period 2001 to<br />
2006)<br />
BNR<br />
NIS<br />
FRSP<br />
RIEPA<br />
MININFRA<br />
• GO3. Infrastructure development enabled to address the<br />
growth of non-traditional exportations which have increased<br />
by 20% per year (forecast of at least 20% per year over the<br />
period 2001 to 2006).<br />
MINICOM<br />
MININFRA<br />
• GO4. Infrastructure development has contributed 20% to the<br />
increase in employment over the period 2001 to 2006 2<br />
MINIFOTRA<br />
MININFRA<br />
• GO5. Infrastructure development has contributed by 20% to<br />
the decrease in the percentage of the populations living<br />
below the poverty line over the period <strong>2007</strong> to 2011 3<br />
NIS<br />
MININFRA<br />
1 The projected contribution of each of the sub-sectors to GDP, on the basis of the data from BNR of 2004, is at least 10 % for Transport and <strong>ICT</strong> (8.1% in 2004); 1% for Energy and<br />
water (0.25% in 2004); 10.5% for Housing and City Planning (10.5% for construction and public works in 2004) and X% for Me<br />
teo (not specified for 2004).<br />
2 For MININFRA contribution to job creation, the same rate as the contribution to GDP (20%).<br />
3 For MININFRA contribution to the increase in the poverty level, the same rate as the contribution to GDP (20%).