2005-2006 Financial Statements and Management Report
2005-2006 Financial Statements and Management Report
2005-2006 Financial Statements and Management Report

You also want an ePaper? Increase the reach of your titles
YUMPU automatically turns print PDFs into web optimized ePapers that Google loves.
12<br />
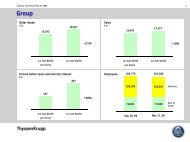
INVESTMENTS IN<br />
GROWTH AREAS STRENGTHEN<br />
COMPETITIVENESS.<br />
CAPITAL EXPENDITURES<br />
Investment by segment in million €<br />
Steel<br />
Stainless<br />
Special Materials<br />
Automotive<br />
Technologies<br />
Elevator<br />
Services<br />
Corporate<br />
Consolidation<br />
Group<br />
All figures relate to continuing operations. * before taxes<br />
In <strong>2005</strong>/<strong>2006</strong>, ThyssenKrupp made investments of €2.1 billion, 9% more than the previous year.<br />
€1,621 million was spent on property, plant <strong>and</strong> equipment <strong>and</strong> intangible assets, while the remaining<br />
€456 million was used for acquisitions. Capital expenditure was €0.7 billion higher than depreciation<br />
(€1.4 billion).<br />
ThyssenKrupp invests strongly in its growth areas to ensure they remain competitive in the future.<br />
More than half of the investments made were to exp<strong>and</strong> capacities <strong>and</strong> production. Other key areas<br />
include increasing the technical efficiency of existing equipment <strong>and</strong> integrating advanced technologies.<br />
Further information can be found in the notes to the consolidated statements of cash flows in the<br />
section “<strong>Financial</strong> position” on pages 44-48.<br />
PROCUREMENT: RAW MATERIAL PRICES STILL HIGH<br />
2004/<strong>2005</strong><br />
537<br />
211<br />
27<br />
480<br />
413<br />
121<br />
190<br />
71<br />
(147)<br />
1,903<br />
<strong>2005</strong>/<strong>2006</strong><br />
Materials expense in the reporting year totaled €29.7 billion, up 11% from the prior year. As well as<br />
increased raw material prices, the rise reflects the higher volume of business. Although markets were<br />
tight in part, supplies were secured at all times.<br />
515<br />
230<br />
–<br />
448<br />
300<br />
164<br />
393<br />
30<br />
(3)<br />
2,077<br />
Iron ore more expensive<br />
Price trends on the international raw material markets varied. Due to continued high dem<strong>and</strong> we had to<br />
accept a 19% rise in the price of fine iron ores. By contrast, we achieved a 3% reduction in the price of<br />
pellets. We purchase most of our ores <strong>and</strong> pellets from suppliers in Brazil, Australia <strong>and</strong> Canada.<br />
Materials expense in billion €<br />
2001/2002<br />
2002/2003<br />
2003/2004<br />
2004/<strong>2005</strong><br />
<strong>2005</strong>/<strong>2006</strong><br />
20.7<br />
20.5<br />
23.2<br />
26.6<br />
29.7