2005-2006 Financial Statements and Management Report
2005-2006 Financial Statements and Management Report
2005-2006 Financial Statements and Management Report

You also want an ePaper? Increase the reach of your titles
YUMPU automatically turns print PDFs into web optimized ePapers that Google loves.
54<br />
GROWTH, EFFICIENCY AND<br />
OPTIMIZATION OF CAPITAL EMPLOYED<br />
ARE LEVERS TO INCREASE VALUE.<br />
Application of the value management system<br />
Three levers can be used to increase tkva: profitable growth, increases in operating efficiency, <strong>and</strong><br />
optimization of capital employed. Value through profitable growth is created in particular by new projects,<br />
provided they generate returns higher than their cost of capital. A major contribution to increasing<br />
operating efficiency is made by the ThyssenKrupp best value enhancement program, which is described<br />
in more detail on pages 56-57.<br />
Capital employed as the third lever to increase tkva can be optimized by withdrawing from business<br />
activities in which the cost of capital cannot be earned. Alternatively, targeted programs can be implemented<br />
to release capital, i.e. to reduce capital employed without reducing ebit.<br />
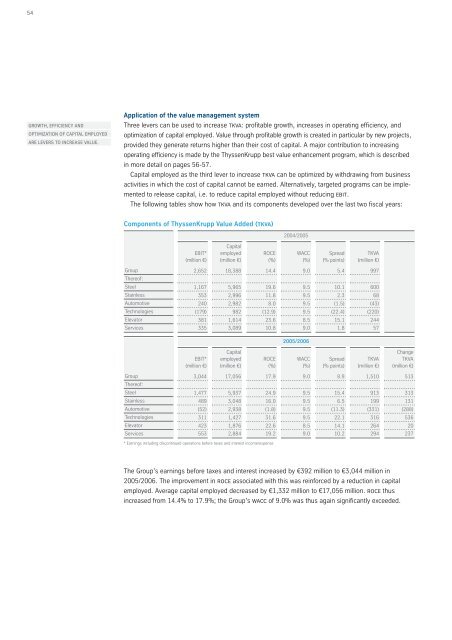
The following tables show how tkva <strong>and</strong> its components developed over the last two fiscal years:<br />
Components of ThyssenKrupp Value Added (tkva)<br />
Group<br />
Thereof:<br />
Steel<br />
Stainless<br />
Automotive<br />
Technologies<br />
Elevator<br />
Services<br />
Group<br />
Thereof:<br />
Steel<br />
Stainless<br />
Automotive<br />
Technologies<br />
Elevator<br />
Services<br />
EBIT*<br />
(million €)<br />
2,652<br />
1,167<br />
353<br />
240<br />
(179)<br />
381<br />
335<br />
EBIT*<br />
(million €)<br />
3,044<br />
1,477<br />
489<br />
(52)<br />
311<br />
423<br />
553<br />
Capital<br />
employed<br />
(million €)<br />
18,388<br />
5,965<br />
2,996<br />
2,982<br />
982<br />
1,614<br />
3,089<br />
Capital<br />
employed<br />
(million €)<br />
17,056<br />
5,937<br />
3,048<br />
2,938<br />
1,427<br />
1,876<br />
2,884<br />
WACC<br />
(%)<br />
Spread<br />
(% points)<br />
TKVA<br />
(million €)<br />
The Group’s earnings before taxes <strong>and</strong> interest increased by €392 million to €3,044 million in<br />
<strong>2005</strong>/<strong>2006</strong>. The improvement in roce associated with this was reinforced by a reduction in capital<br />
employed. Average capital employed decreased by €1,332 million to €17,056 million. roce thus<br />
increased from 14.4% to 17.9%; the Group’s wacc of 9.0% was thus again significantly exceeded.<br />
ROCE<br />
(%)<br />
14.4<br />
19.6<br />
11.8<br />
8.0<br />
(12.9)<br />
23.6<br />
10.8<br />
ROCE<br />
(%)<br />
17.9<br />
24.9<br />
16.0<br />
(1.8)<br />
31.6<br />
22.6<br />
19.2<br />
* Earnings including discontinued operations before taxes <strong>and</strong> interest income/expense<br />
2004/<strong>2005</strong><br />
9.0<br />
9.5<br />
9.5<br />
9.5<br />
9.5<br />
8.5<br />
9.0<br />
<strong>2005</strong>/<strong>2006</strong><br />
WACC<br />
(%)<br />
9.0<br />
9.5<br />
9.5<br />
9.5<br />
9.5<br />
8.5<br />
9.0<br />
5.4<br />
10.1<br />
2.3<br />
(1.5)<br />
(22.4)<br />
15.1<br />
1.8<br />
Spread<br />
(% points)<br />
8.9<br />
15.4<br />
6.5<br />
(11.3)<br />
22.1<br />
14.1<br />
10.2<br />
997<br />
600<br />
68<br />
(43)<br />
(220)<br />
244<br />
57<br />
TKVA<br />
(million €)<br />
1,510<br />
913<br />
199<br />
(331)<br />
316<br />
264<br />
294<br />
Change<br />
TKVA<br />
(million €)<br />
513<br />
313<br />
131<br />
(288)<br />
536<br />
20<br />
237