

Tana Delta Irrigation Project, Kenya: An Environmental Assessment
Tana Delta Irrigation Project, Kenya: An Environmental Assessment
Tana Delta Irrigation Project, Kenya: An Environmental Assessment

Create successful ePaper yourself
Turn your PDF publications into a flip-book with our unique Google optimized e-Paper software.
Rehabilitation of the <strong>Tana</strong> <strong>Delta</strong> <strong>Irrigation</strong> <strong>Project</strong>, <strong>Kenya</strong>: <strong>An</strong> <strong>Environmental</strong> <strong>Assessment</strong>.<br />
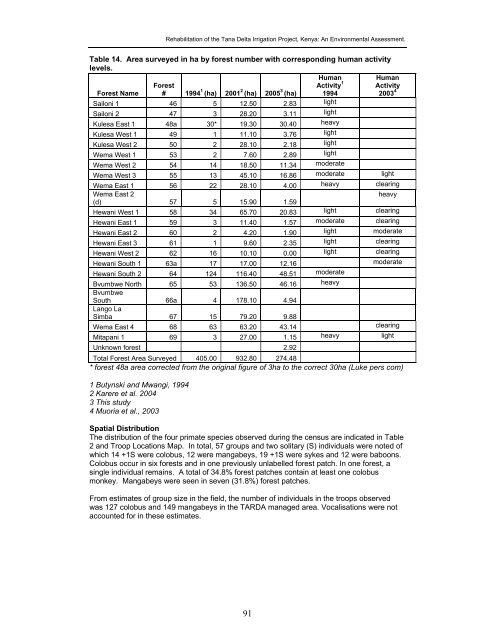
Table 14. Area surveyed in ha by forest number with corresponding human activity<br />
levels.<br />
Human<br />
Forest Name<br />
Forest<br />
# 1994 1 (ha) 2001 2 (ha) 2005 3 (ha)<br />
Activity 1<br />
1994<br />
Sailoni 1 46 5 12.50 2.83 light<br />
Sailoni 2 47 3 28.20 3.11 light<br />
Kulesa East 1 48a 30* 19.30 30.40 heavy<br />
Kulesa West 1 49 1 11.10 3.76 light<br />
Kulesa West 2 50 2 28.10 2.18 light<br />
Wema West 1 53 2 7.60 2.89 light<br />
Wema West 2 54 14 18.50 11.34 moderate<br />
Human<br />
Activity<br />
2003 4<br />
Wema West 3 55 13 45.10 16.86 moderate light<br />
Wema East 1 56 22 28.10 4.00 heavy clearing<br />
Wema East 2<br />
heavy<br />
(d) 57 5 15.90 1.59<br />
Hewani West 1 58 34 65.70 20.83 light clearing<br />
Hewani East 1 59 3 11.40 1.57 moderate clearing<br />
Hewani East 2 60 2 4.20 1.90 light moderate<br />
Hewani East 3 61 1 9.60 2.35 light clearing<br />
Hewani West 2 62 16 10.10 0.00 light clearing<br />
Hewani South 1 63a 17 17.00 12.16 moderate<br />
Hewani South 2 64 124 116.40 48.51 moderate<br />
Bvumbwe North 65 53 136.50 46.16 heavy<br />
Bvumbwe<br />
South 66a 4 178.10 4.94<br />
Lango La<br />
Simba 67 15 79.20 9.88<br />
Wema East 4 68 63 63.20 43.14 clearing<br />
Mitapani 1 69 3 27.00 1.15 heavy light<br />
Unknown forest 2.92<br />
Total Forest Area Surveyed 405.00 932.80 274.48<br />
* forest 48a area corrected from the original figure of 3ha to the correct 30ha (Luke pers com)<br />
1 Butynski and Mwangi, 1994<br />
2 Karere et al. 2004<br />
3 This study<br />
4 Muoria et al., 2003<br />
Spatial Distribution<br />
The distribution of the four primate species observed during the census are indicated in Table<br />
2 and Troop Locations Map. In total, 57 groups and two solitary (S) individuals were noted of<br />
which 14 +1S were colobus, 12 were mangabeys, 19 +1S were sykes and 12 were baboons.<br />
Colobus occur in six forests and in one previously unlabelled forest patch. In one forest, a<br />
single individual remains. A total of 34.8% forest patches contain at least one colobus<br />
monkey. Mangabeys were seen in seven (31.8%) forest patches.<br />
From estimates of group size in the field, the number of individuals in the troops observed<br />
was 127 colobus and 149 mangabeys in the TARDA managed area. Vocalisations were not<br />
accounted for in these estimates.<br />
91


