

Tana Delta Irrigation Project, Kenya: An Environmental Assessment
Tana Delta Irrigation Project, Kenya: An Environmental Assessment
Tana Delta Irrigation Project, Kenya: An Environmental Assessment

Create successful ePaper yourself
Turn your PDF publications into a flip-book with our unique Google optimized e-Paper software.
Rehabilitation of the <strong>Tana</strong> <strong>Delta</strong> <strong>Irrigation</strong> <strong>Project</strong>, <strong>Kenya</strong>: <strong>An</strong> <strong>Environmental</strong> <strong>Assessment</strong>.<br />
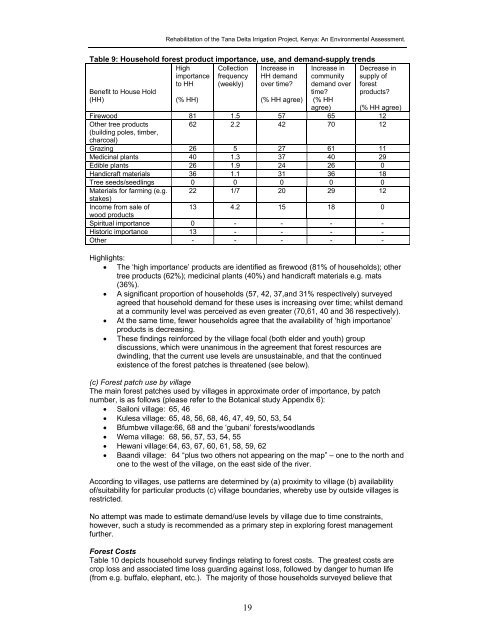
Table 9: Household forest product importance, use, and demand-supply trends<br />
High Collection Increase in<br />
importance frequency HH demand<br />
to HH (weekly) over time?<br />
Benefit to House Hold<br />
(HH)<br />
Increase in<br />
community<br />
demand over<br />
time?<br />
(% HH<br />
agree)<br />
Decrease in<br />
supply of<br />
forest<br />
products?<br />
(% HH)<br />
(% HH agree)<br />
(% HH agree)<br />
Firewood 81 1.5 57 65 12<br />
Other tree products<br />
62 2.2 42 70 12<br />
(building poles, timber,<br />
charcoal)<br />
Grazing 26 5 27 61 11<br />
Medicinal plants 40 1.3 37 40 29<br />
Edible plants 26 1.9 24 26 0<br />
Handicraft materials 36 1.1 31 36 18<br />
Tree seeds/seedlings 0 0 0 0 0<br />
Materials for farming (e.g. 22 1/7 20 29 12<br />
stakes)<br />
Income from sale of<br />
13 4.2 15 18 0<br />
wood products<br />
Spiritual importance 0 - - - -<br />
Historic importance 13 - - - -<br />
Other - - - - -<br />
Highlights:<br />
• The ‘high importance’ products are identified as firewood (81% of households); other<br />
tree products (62%); medicinal plants (40%) and handicraft materials e.g. mats<br />
(36%).<br />
• A significant proportion of households (57, 42, 37,and 31% respectively) surveyed<br />
agreed that household demand for these uses is increasing over time; whilst demand<br />
at a community level was perceived as even greater (70,61, 40 and 36 respectively).<br />
• At the same time, fewer households agree that the availability of ‘high importance’<br />
products is decreasing.<br />
• These findings reinforced by the village focal (both elder and youth) group<br />
discussions, which were unanimous in the agreement that forest resources are<br />
dwindling, that the current use levels are unsustainable, and that the continued<br />
existence of the forest patches is threatened (see below).<br />
(c) Forest patch use by village<br />
The main forest patches used by villages in approximate order of importance, by patch<br />
number, is as follows (please refer to the Botanical study Appendix 6):<br />
• Sailoni village: 65, 46<br />
• Kulesa village: 65, 48, 56, 68, 46, 47, 49, 50, 53, 54<br />
• Bfumbwe village: 66, 68 and the ‘gubani’ forests/woodlands<br />
• Wema village: 68, 56, 57, 53, 54, 55<br />
• Hewani village: 64, 63, 67, 60, 61, 58, 59, 62<br />
• Baandi village: 64 “plus two others not appearing on the map” – one to the north and<br />
one to the west of the village, on the east side of the river.<br />
According to villages, use patterns are determined by (a) proximity to village (b) availability<br />
of/suitability for particular products (c) village boundaries, whereby use by outside villages is<br />
restricted.<br />
No attempt was made to estimate demand/use levels by village due to time constraints,<br />
however, such a study is recommended as a primary step in exploring forest management<br />
further.<br />
Forest Costs<br />
Table 10 depicts household survey findings relating to forest costs. The greatest costs are<br />
crop loss and associated time loss guarding against loss, followed by danger to human life<br />
(from e.g. buffalo, elephant, etc.). The majority of those households surveyed believe that<br />
19


