

Tana Delta Irrigation Project, Kenya: An Environmental Assessment
Tana Delta Irrigation Project, Kenya: An Environmental Assessment
Tana Delta Irrigation Project, Kenya: An Environmental Assessment

Create successful ePaper yourself
Turn your PDF publications into a flip-book with our unique Google optimized e-Paper software.
Rehabilitation of the <strong>Tana</strong> <strong>Delta</strong> <strong>Irrigation</strong> <strong>Project</strong>, <strong>Kenya</strong>: <strong>An</strong> <strong>Environmental</strong> <strong>Assessment</strong>.<br />
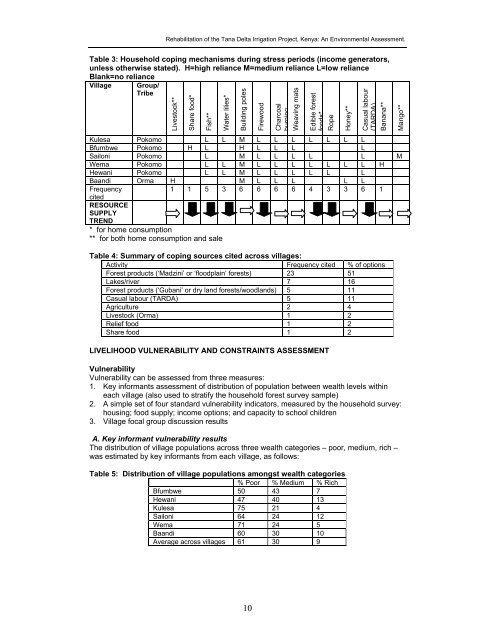
Table 3: Household coping mechanisms during stress periods (income generators,<br />
unless otherwise stated). H=high reliance M=medium reliance L=low reliance<br />
Blank=no reliance<br />
Village<br />
Group/<br />
Tribe<br />
Livestock**<br />
Share food*<br />
Fish**<br />
Water lilies*<br />
Building poles<br />
Firewood<br />
Charcoal<br />
burning<br />
Weaving mats<br />
Edible forest<br />
foods*<br />
Rope<br />
Honey**<br />
Casual labour<br />
(TARDA)<br />
Banana**<br />
Mango**<br />
Kulesa Pokomo L L M L L L L L L L<br />
Bfumbwe Pokomo H L H L L L L<br />
Sailoni Pokomo L M L L L L L M<br />
Wema Pokomo L L M L L L L L L L H<br />
Hewani Pokomo L L M L L L L L L<br />
Baandi Orma H M L L L L L<br />
Frequency<br />
1 1 5 3 6 6 6 6 4 3 3 6 1<br />
cited<br />
RESOURCE<br />
SUPPLY<br />
TREND<br />
* for home consumption<br />
** for both home consumption and sale<br />
Table 4: Summary of coping sources cited across villages:<br />
Activity Frequency cited % of options<br />
Forest products (‘Madzini’ or ‘floodplain’ forests) 23 51<br />
Lakes/river 7 16<br />
Forest products (‘Gubani’ or dry land forests/woodlands) 5 11<br />
Casual labour (TARDA) 5 11<br />
Agriculture 2 4<br />
Livestock (Orma) 1 2<br />
Relief food 1 2<br />
Share food 1 2<br />
LIVELIHOOD VULNERABILITY AND CONSTRAINTS ASSESSMENT<br />
Vulnerability<br />
Vulnerability can be assessed from three measures:<br />
1. Key informants assessment of distribution of population between wealth levels within<br />
each village (also used to stratify the household forest survey sample)<br />
2. A simple set of four standard vulnerability indicators, measured by the household survey:<br />
housing; food supply; income options; and capacity to school children<br />
3. Village focal group discussion results<br />
A. Key informant vulnerability results<br />
The distribution of village populations across three wealth categories – poor, medium, rich –<br />
was estimated by key informants from each village, as follows:<br />
Table 5: Distribution of village populations amongst wealth categories<br />
% Poor % Medium % Rich<br />
Bfumbwe 50 43 7<br />
Hewani 47 40 13<br />
Kulesa 75 21 4<br />
Sailoni 64 24 12<br />
Wema 71 24 5<br />
Baandi 60 30 10<br />
Average across villages 61 30 9<br />
10


