Issue of Annual Report 2010
Issue of Annual Report 2010
Issue of Annual Report 2010

You also want an ePaper? Increase the reach of your titles
YUMPU automatically turns print PDFs into web optimized ePapers that Google loves.
Our Growth<br />
Sapporo Holdings Limited<br />
<strong>Annual</strong> <strong>Report</strong> <strong>2010</strong>
Gains Traction<br />
Contents<br />
Sapporo Group Management Plan 2011–2012<br />
Group Portfolio at a Glance<br />
Overseas Deployment<br />
02 Financial Highlights<br />
04 To Our Stakeholders<br />
06 Interview With the President<br />
12 Feature 1: Vietnam Brewery Operation<br />
14 Feature 2: Management Integration With<br />
POKKA CORPORATION<br />
16 Performance Review and Plan<br />
16 Alcoholic Beverages (Japan)<br />
18 Alcoholic Beverages (International)<br />
20 S<strong>of</strong>t Drinks<br />
21 Restaurants<br />
22 Real Estate<br />
23 Corporate Governance<br />
26 Board <strong>of</strong> Directors and Auditors<br />
28 Five-Year Summary<br />
29 Management’s Discussion and Analysis<br />
32 Consolidated Balance Sheets<br />
34 Consolidated Statements <strong>of</strong> Income<br />
35 Consolidated Statements <strong>of</strong> Shareholders’ Equity<br />
36 Consolidated Statements <strong>of</strong> Cash Flows<br />
37 Notes to Consolidated Financial Statements<br />
57 Corporate Data<br />
*All figures in this annual report are rounded to the nearest<br />
applicable unit.<br />
SAPPORO HOLDINGS LIMITED<br />
<strong>Annual</strong> <strong>Report</strong> <strong>2010</strong>
Sapporo Group Management Plan 2011–2012<br />
Group Portfolio at a Glance<br />
■ International Alcoholic Beverages ■ POKKA ■ Japanese Alcoholic Beverages ■ Real Estate ■ S<strong>of</strong>t Drinks ■ Restaurants<br />
<strong>2010</strong> 2012 Target<br />
Group Synergies<br />
Growth Drivers<br />
6%<br />
7% 7%<br />
9%<br />
¥389.2<br />
Net Sales (¥ billion)<br />
5% 6%<br />
8%<br />
5%<br />
¥519.5<br />
Target<br />
20%<br />
72%<br />
■ ¥25.4 ➔ ¥32.2<br />
■ – ➔ ¥103.9<br />
■ ¥279.3 ➔ ¥290.6<br />
■ ¥23.5 ➔ ¥24.7<br />
■ ¥33.9 ➔ ¥39.8<br />
■ ¥26.4 ➔ ¥26.3<br />
56%<br />
*The result <strong>of</strong> ¥0.6 billion → ¥2.0 billion for Other<br />
has been omitted from the pie charts.<br />
Earnings Stabilities<br />
1%<br />
7% 3%<br />
1%<br />
3%3% 10%<br />
42%<br />
¥15.4 48%<br />
Operating Income (¥ billion)<br />
■ ¥0.5 ➔ ¥0.3<br />
■ – ➔ ¥2.4<br />
■ ¥9.2 ➔ ¥10.6<br />
■ ¥8.0 ➔ ¥9.0<br />
■ ¥1.3 ➔ ¥0.7<br />
■ ¥0.2 ➔ ¥0.6<br />
38%<br />
¥20.0<br />
Target<br />
45%<br />
*Results <strong>of</strong> –¥0.7 billion → –¥0.3 billion for Other and<br />
–¥3.0 billion → –¥3.3 billion for general corporate<br />
and intercompany eliminations have been omitted<br />
from the pie charts.<br />
Note: All figures in this annual report are rounded to the nearest applicable unit.<br />
All Management Plan figures are derived from a simplified segment classification method based on the management approach.
Business Segments from 2011<br />
Net Sales<br />
(Incl. alcohol taxes)<br />
(¥ Million)<br />
Operating Income<br />
(Loss)<br />
(¥ Million)<br />
Key Themes<br />
Growth Drivers<br />
Earnings Stabilities<br />
Group Synergies<br />
International Alcoholic Beverages<br />
• SAPPORO INTERNATIONAL INC.<br />
• SAPPORO U.S.A., INC.<br />
• SAPPORO CANADA INC.<br />
• SLEEMAN BREWERIES LTD.<br />
• Sapporo Asia Private Limited<br />
• Sapporo Vietnam Limited<br />
POKKA GROUP<br />
• POKKA CORPORATION<br />
• SUN POKKA CO., LTD.<br />
• POKKA CREATE CO., LTD.<br />
And another 22 companies<br />
Japanese Alcoholic Beverages<br />
• SAPPORO BREWERIES LTD.<br />
• SAPPORO WINES LIMITED<br />
• YEBISU WINEMART CO., LTD.<br />
• SAPPORO LOGISTICS SYSTEMS CO., LTD.<br />
• TANOSHIMARU SHUZO CO., LTD.<br />
• SAPPORO ENGINEERING LIMITED<br />
• STARNET CO.,LTD.<br />
• NEW SANKO INC.<br />
Real Estate<br />
• YEBISU GARDEN PLACE CO., LTD.<br />
• YGP REAL ESTATE CO., LTD.<br />
• SAPPORO URBAN DEVELOPMENT CO., LTD.<br />
• TOKYO ENERGY SERVICE CO., LTD.<br />
• SAPPORO SPORTS PLAZA CO., LTD.<br />
• YOKOHAMA KEIWA BUILDING CO., LTD.<br />
S<strong>of</strong>t Drinks<br />
• SAPPORO BEVERAGE CO., LTD.<br />
• STELLA BEVERAGE SERVICE CO., LTD.<br />
• STAR BEVERAGE SERVICE CO., LTD.<br />
Restaurants<br />
• SAPPORO LION LIMITED<br />
40,000<br />
30,000<br />
20,000<br />
10,000<br />
0<br />
120,000<br />
80,000<br />
40,000<br />
0<br />
300,000<br />
200,000<br />
100,000<br />
0<br />
30,000<br />
20,000<br />
10,000<br />
0<br />
40,000<br />
30,000<br />
20,000<br />
10,000<br />
0<br />
30,000<br />
20,000<br />
10,000<br />
0<br />
25,386<br />
29,200<br />
32,200<br />
0<br />
10 11 12 (Target)<br />
3,000<br />
2,000<br />
1,000<br />
0<br />
10 11 12 (Target)<br />
12,000<br />
8,000<br />
4,000<br />
0<br />
10 11 12 (Target)<br />
10,000<br />
7,500<br />
5,000<br />
2,500<br />
0<br />
10 11 12 (Target)<br />
1,500<br />
1,000<br />
500<br />
0<br />
10 11 12 (Target)<br />
600<br />
400<br />
200<br />
0<br />
10 11 12 (Target)<br />
279,312<br />
23,537<br />
33,946<br />
26,429<br />
78,900<br />
286,700<br />
23,000<br />
37,400<br />
25,500<br />
103,900<br />
290,600<br />
24,700<br />
39,800<br />
26,300<br />
600<br />
400<br />
200<br />
502<br />
100<br />
300<br />
10 11 12 (Target)<br />
2,300<br />
2,400<br />
10 11 12 (Target)<br />
9,234<br />
9,800<br />
10,600<br />
10 11 12 (Target)<br />
8,003<br />
8,300<br />
9,000<br />
10 11 12 (Target)<br />
1,287<br />
700<br />
700<br />
10 11 12 (Target)<br />
150<br />
400<br />
600<br />
10 11 12 (Target)<br />
We will strengthen and expand our brand in North<br />
America and Asia as our top priorities while also expanding<br />
beyond our traditional alcoholic beverages operations<br />
to transform the International Alcoholic Beverages<br />
business into broader International Operations.<br />
➔ P. 12 ➔ P. 18–19<br />
Drive growth by harnessing Group synergies with each<br />
segment.<br />
➔ P. 14–15<br />
To achieve sustained growth, we will aim to provide<br />
the greatest excitement and joy to customers in the<br />
beer, shochu, wine, and RTD (ready-to-drink) sectors<br />
while implementing structural reforms and working<br />
vigorously to achieve our sales and pr<strong>of</strong>it targets.<br />
➔ P. 16–17<br />
We will work to maintain and reinforce our stable pr<strong>of</strong>it<br />
structure and enhance the value <strong>of</strong> the SAPPORO<br />
Group’s properties. We will carefully screen new prospects<br />
and acquire only prime properties.<br />
➔ P. 22<br />
The S<strong>of</strong>t Drinks business will pursue a growth strategy<br />
based on brand-building and undertake measures<br />
designed to boost its operating margin.<br />
➔ P. 20<br />
We will work to invigorate existing restaurants and<br />
develop formats differentiated from the competition.<br />
We will also undertake cost structure reforms from a<br />
medium-term perspective to enable the business to<br />
weather economic change.<br />
➔ P. 21<br />
Other Businesses (Foods)<br />
• SAPPORO FOODS NET CO., LTD.<br />
• SAPPORO FINE FOODS CO., LTD.<br />
• SAPPORO GROUP MANAGEMENT CO., LTD.<br />
Key Theme<br />
We will seek to <strong>of</strong>fer a line <strong>of</strong> distinctive products and expand pr<strong>of</strong>its in the Foods business through<br />
maximization <strong>of</strong> intra-group synergies, streamlining, and greater efficiency.<br />
➔ P. 20
Overseas deployment<br />
Vietnam<br />
SAPPORO VIETNAM LIMITED<br />
to produce beer and wholesale<br />
alcoholic beverages<br />
from fall <strong>of</strong> 2011.<br />
➔ P. 12 Feature<br />
Singapore<br />
Expanding sales channels<br />
and entering the household<br />
market in cooperation with<br />
POKKA CORPORATION.<br />
➔ P. 14 Feature<br />
Japan<br />
South Korea<br />
Entered into an alliance with<br />
South Korean company<br />
Maeil Dairies Co., Ltd. in<br />
November <strong>2010</strong> for selling<br />
beer in South Korea.<br />
Hong Kong<br />
26 restaurants in Hong<br />
Kong operated by POKKA<br />
Corporation (HK) Ltd.<br />
➔ P. 14 Feature<br />
Canada<br />
SLEEMAN BREWERIES LTD.<br />
USA<br />
SAPPORO U.S.A., INC.<br />
<strong>Annual</strong> <strong>Report</strong> <strong>2010</strong> 01<br />
SAPPORO HOLDINGS LIMITED
Financial Highlights (Years ended December 31)<br />
Thousands <strong>of</strong><br />
Millions <strong>of</strong> yen<br />
U.S. dollars<br />
<strong>2010</strong> 2009 2008 2007 2006 <strong>2010</strong><br />
For the Year<br />
Net sales<br />
Including tax . . . . . . . . . . . . . . . . . . . . . . . ¥389,245 ¥387,534 ¥414,558 ¥449,011 ¥435,090 $4,779,528<br />
Excluding tax . . . . . . . . . . . . . . . . . . . . . . 269,874 264,604 284,412 309,794 294,066 3,313,778<br />
Operating income . . . . . . . . . . . . . . . . . . . . . 15,403 12,896 14,685 12,363 8,613 189,134<br />
EBITDA . . . . . . . . . . . . . . . . . . . . . . . . . . . . . 39,080 36,475 37,158 37,759 30,543 479,865<br />
Net income . . . . . . . . . . . . . . . . . . . . . . . . . . 10,773 4,535 7,640 5,509 2,338 132,277<br />
Capital expenditures . . . . . . . . . . . . . . . . . . 22,571 23,485 29,378 19,548 30,790 277,155<br />
Depreciation and amortization . . . . . . . . . . 22,504 22,547 21,605 24,527 21,930 276,328<br />
Cash flows from operating activities . . . . . 27,431 12,454 22,292 30,691 28,589 336,825<br />
Cash flows from investing activities . . . . . . (2,595) (32,227) 16,856 (13,495) (54,415) (31,863)<br />
Free cash flows . . . . . . . . . . . . . . . . . . . . . . . 24,836 (19,773) 39,148 17,196 (25,826) 304,962<br />
Cash flows from financing activities. . . . . . (18,120) 3,746 (22,207) (19,569) 9,352 (222,489)<br />
At Year End<br />
Net assets . . . . . . . . . . . . . . . . . . . . . . . . . . . 126,645 118,591 116,862 125,189 113,496 1,555,077<br />
Total assets . . . . . . . . . . . . . . . . . . . . . . . . . . 494,798 506,875 527,287 561,859 589,597 6,075,619<br />
Financial liabilities . . . . . . . . . . . . . . . . . . . . 181,335 196,794 189,252 212,464 236,033 2,226,609<br />
Other Indicators<br />
Overseas sales ratio . . . . . . . . . . . . . . . . . . . 9.4% 8.5% 8.8% 9.0% 1.8%<br />
Operating income to net sales (Incl. tax) . . 4.0% 3.3% 3.5% 2.8% 2.0%<br />
(Excl. tax) . . 5.7% 4.9% 5.2% 4.0% 2.9%<br />
Debt-to-equity ratio (times) . . . . . . . . . . . . . 1.4 1.7 1.6 1.7 2.1<br />
Equity ratio . . . . . . . . . . . . . . . . . . . . . . . . . . 25.3% 23.4% 22.1% 22.3% 19.2%<br />
ROE . . . . . . . . . . . . . . . . . . . . . . . . . . . . . . . . 8.9% 3.9% 6.3% 4.6% 2.1%<br />
Yen<br />
U.S. dollars<br />
Per share<br />
Net income<br />
Primary . . . . . . . . . . . . . . . . . . . . . . . . . . . . ¥27.50 ¥11.57 ¥19.49 ¥14.10 ¥6.38 $0.34<br />
Diluted . . . . . . . . . . . . . . . . . . . . . . . . . . . . 26.44 11.05 18.89 13.76 5.88 0.32<br />
Cash dividends . . . . . . . . . . . . . . . . . . . . . . . 7.00 7.00 7.00 5.00 5.00 0.09<br />
Note: U.S. dollar amounts translated from Japanese yen, for convenience only, at the rate <strong>of</strong> ¥81.44=US$1, the exchange rate prevailing on December 31, <strong>2010</strong>.<br />
Free cash flows are Cash flows from operating activities and Cash flows from investing activities.<br />
EBITDA = Operating income + Depreciation and amortization + Amortization <strong>of</strong> goodwill<br />
Financial liabilities include commercial paper but excludes the balance <strong>of</strong> lease obligations.<br />
02<br />
SAPPORO HOLDINGS LIMITED<br />
<strong>Annual</strong> <strong>Report</strong> <strong>2010</strong>
Net Sales<br />
(¥ Million)<br />
Operating Income<br />
(¥ Million)<br />
Net Income<br />
(¥ Million)<br />
500,000<br />
18,000<br />
12,000<br />
400,000<br />
300,000<br />
12,000<br />
8,000<br />
200,000<br />
100,000<br />
6,000<br />
4,000<br />
0<br />
0<br />
0<br />
06 07 08 09 10<br />
06 07 08 09 10<br />
06<br />
07<br />
08<br />
09<br />
10<br />
EBITDA<br />
(¥ Million)<br />
Net Assets and ROE<br />
(¥ Million, %)<br />
Total Assets and ROA<br />
(¥ Million, %)<br />
40,000<br />
150,000<br />
9<br />
600,000<br />
3<br />
30,000<br />
100,000<br />
6<br />
400,000<br />
2<br />
20,000<br />
10,000<br />
50,000<br />
3<br />
200,000<br />
1<br />
0<br />
0<br />
0<br />
0<br />
0<br />
06<br />
07<br />
08<br />
09<br />
10<br />
06<br />
07<br />
08<br />
09<br />
10<br />
06<br />
07<br />
08<br />
09<br />
10<br />
■ Net Assets (left scale)<br />
■ ROE (right scale)<br />
■ Total Assets (left scale)<br />
■ ROA (right scale)<br />
Depreciation and Amortization and<br />
Capital Expenditures<br />
(¥ Million)<br />
Financial Liabilities and Debt<br />
Equity Ratio<br />
(¥ Million, Times)<br />
Free Cash Flows<br />
(¥ Million)<br />
30,000<br />
250,000<br />
2.5<br />
40,000<br />
20,000<br />
200,000<br />
150,000<br />
2.0<br />
1.5<br />
30,000<br />
20,000<br />
10,000<br />
10,000<br />
100,000<br />
50,000<br />
1.0<br />
0.5<br />
0<br />
–10,000<br />
–20,000<br />
0<br />
0<br />
0<br />
–30,000<br />
06<br />
07<br />
08<br />
09<br />
10<br />
06<br />
07<br />
08<br />
09<br />
10<br />
06<br />
07<br />
08<br />
09<br />
10<br />
■ Depreciation and Amortization<br />
■ Capital Expenditures<br />
■ Financial Liabilities (left scale)<br />
■ Debt-to-Equity Ratio (right scale)<br />
SAPPORO HOLDINGS LIMITED<br />
<strong>Annual</strong> <strong>Report</strong> <strong>2010</strong><br />
03
To Our Stakeholders<br />
On March 11, 2011, the Tohoku Pacific Earthquake and the<br />
ensuing tsunami wrought a disaster <strong>of</strong> unprecedented scale<br />
centered on the Tohoku region, and affecting the Kanto region<br />
as well. We <strong>of</strong>fer our condolences to all those affected, and we<br />
report on the status <strong>of</strong> the Sapporo Group.<br />
The Sendai Brewery and Chiba Brewery <strong>of</strong> Sapporo<br />
Breweries Ltd. suffered partial damage to buildings and equipment.<br />
At other plants also, operation <strong>of</strong> some equipment was<br />
put on hold and even now that they have restarted, operations<br />
continue to be affected by rolling power cuts in Tokyo and other<br />
factors. Sapporo Lion Ltd. had to stop operations at some restaurants,<br />
particularly in disaster-hit areas, while damage to<br />
infrastructure in various areas forced other restaurants to operate<br />
on shorter hours, or take other measures. Yebisu Garden<br />
Place Co., Ltd. was obliged to limit usage <strong>of</strong> some <strong>of</strong> its properties<br />
and facilities, but the buildings did not suffer any major<br />
damage, and continued to operate.<br />
At this time it is difficult to estimate the impact <strong>of</strong> the earthquake<br />
on our forecast for the year ending December 2011. We<br />
will disclose the information as soon as it can be estimated.<br />
Moreover, the Sapporo Group immediately contributed donations<br />
<strong>of</strong> money, drinking water, and other gifts to areas stricken<br />
by the disaster, and employees at our group companies followed<br />
up with further fundraising activities.<br />
04<br />
SAPPORO HOLDINGS LIMITED<br />
<strong>Annual</strong> <strong>Report</strong> <strong>2010</strong>
I’d like to take this opportunity to report this year’s increase<br />
in sales and income, and to report that we have shifted to a<br />
new management framework to ensure the progress <strong>of</strong> our<br />
management plan.<br />
Business Climate and Strategies in Fiscal <strong>2010</strong><br />
During <strong>2010</strong> the s<strong>of</strong>t drinks market saw a surge in demand<br />
spurred by one <strong>of</strong> the hottest summers on record. Alcohol and<br />
restaurant markets, however, were heavily affected by a slump<br />
in consumer spending and demand growth in these sectors was<br />
below expectations. In the real estate industry, the occupancy<br />
rates in the Tokyo <strong>of</strong>fice rental market bottomed out in the latter<br />
half <strong>of</strong> the year, but rents continued to fall throughout the year.<br />
Under these conditions the Sapporo Group tackled the key<br />
themes <strong>of</strong> its Sapporo Group Management Plan <strong>2010</strong>–2011:<br />
We launched growth strategies to pave the way to future growth,<br />
and we strengthened our existing businesses by concentrating<br />
management resources on our core brands in each business.<br />
Specifically, we started construction work on a new plant in<br />
Vietnam, where we have entered the beer business, formed a<br />
capital and business alliance with Kyodo Milk Industry Co., Ltd.,<br />
and made a business alliance with South Korean Maeil Dairies<br />
Co., Ltd. for a beer business in the South Korea. These steps<br />
will be followed by a management integration with POKKA<br />
CORPORATION scheduled for April 2011.<br />
Vietnam were excluded from Alcoholic Beverages (International).<br />
Moreover, with the contribution from gain on the sale <strong>of</strong> our<br />
Osaka Plant site, net income was ¥10.8 billion, up by a hefty<br />
¥6.2 billion, or 138% from the previous year, boosting ROE<br />
considerably to 8.9% from 3.9% in the previous year.<br />
Policy on Dividends<br />
Returning an appropriate level <strong>of</strong> earnings to our shareholders<br />
in view <strong>of</strong> our operating results and financial position is an<br />
important management policy for Sapporo Holdings, and our<br />
basic policy is to maintain a stable dividend. We plan to use<br />
retained earnings to maximize our corporate value by strategically<br />
investing it in growth areas and using it to strengthen our<br />
financial base, in line with our management plan.<br />
Enhancing Corporate Governance<br />
Strengthening and enhancing corporate governance is a key<br />
management priority for the Sapporo Group. To improve transparency<br />
and strengthen oversight functions for management, we<br />
have three outside directors. Outside board members serve as<br />
chairpersons for various committees. For more information about<br />
these committees, please see the Corporate Governance section<br />
<strong>of</strong> this report starting on page 23.<br />
Increased Sales and Income from All<br />
Revenue Sources<br />
The Alcoholic Beverages (Japan) business saw year-on-year<br />
sales volumes increase for the first time in six years. The<br />
Alcoholic Beverages (International) business and the S<strong>of</strong>t Drinks<br />
business both recorded significant year-on-year increases in<br />
sales, with the Alcoholic Beverages (International) business<br />
supported by continued brisk sales in North America. There was<br />
good news from the Real Estate business too, where sales<br />
were also up. As a result, consolidated net sales were ¥389.2<br />
billion, up ¥1.7 billion, or 0% from the previous year. Operating<br />
income was ¥15.4 billion, an increase <strong>of</strong> ¥2.5 billion, or 19%<br />
from the previous year. Operating income increased in all business<br />
segments when investment costs <strong>of</strong> expanding into<br />
TAKAO MURAKAMI<br />
Chairman and Representative Director<br />
SAPPORO HOLDINGS LIMITED<br />
<strong>Annual</strong> <strong>Report</strong> <strong>2010</strong><br />
05
Interview With the President<br />
Solidifying Our Growth<br />
Trajectory and Aiming<br />
for Dramatic Growth<br />
Business performance in <strong>2010</strong> ended with top- and bottom-line<br />
growth for the Sapporo Group. Building on these results, the<br />
Group formulated Management Plan 2011–2012 as a new twoyear<br />
rolling plan. With sights on realizing its New Management<br />
Framework aimed at dramatic growth, the Sapporo Group is<br />
determined to firmly establish its growth trajectory.<br />
TSUTOMU KAMIJO<br />
President and Representative Director, Group CEO<br />
06<br />
SAPPORO HOLDINGS LIMITED<br />
<strong>Annual</strong> <strong>Report</strong> <strong>2010</strong>
Summary <strong>of</strong> Management Plan <strong>2010</strong>–2011<br />
Question 1<br />
In <strong>2010</strong>, the aim <strong>of</strong> the Management Plan was to help the Sapporo Group to transition<br />
from a phase for strengthening the earnings base to one <strong>of</strong> growth. Initiating growth<br />
strategies and strengthening existing businesses were two core strategies <strong>of</strong> this plan,<br />
were your measures for these strategies this year ultimately successful?<br />
Operating Income and EBITDA<br />
(¥ Billion)<br />
50<br />
40<br />
30<br />
20<br />
10<br />
0<br />
12.9<br />
36.5<br />
■ Operating Income<br />
■ EBITDA<br />
15.4<br />
39.1<br />
18.0<br />
47.2<br />
09 10 11<br />
(Forecast)<br />
Answer 1<br />
Strengthening Existing Businesses<br />
In each business we sought to build competitive advantages by concentrating<br />
our management resources on our strong brands and enhancing our ability to<br />
adapt to environmental changes.<br />
In our core businesses, Alcoholic Beverages (Japan), we conducted marketing<br />
activities focused on our main beer products. As a result, sales volume outstripped<br />
that <strong>of</strong> the previous year despite a contraction in the domestic market, meaning<br />
that we boosted our market share. In Alcoholic Beverages (International), we<br />
reported earnings growth across all operations, with the exception <strong>of</strong> losses in<br />
Vietnam due to upfront investment to support expansion in this market. SLEEMAN<br />
BREWERIES LTD., for example, posted year-on-year growth in sales volume for a<br />
fourth consecutive year, while Sapporo U.S.A., Inc. recorded double-digit growth.<br />
Our D/E ratio also improved through efforts to minimize financial liabilities; in addition,<br />
our capital strength was bolstered by earnings growth. All told, these outcomes<br />
have given the Sapporo Group greater earnings power and a more robust<br />
financial base for promoting future growth strategies.<br />
Initiating Growth Strategies<br />
To make the prospects <strong>of</strong> medium- and long-term improvement in value<br />
for the Group more certain, we enacted initiatives to pave the way for<br />
future growth.<br />
Turning to business in Vietnam, where we announced our plans for expanding in<br />
December 2009, we began construction <strong>of</strong> a brewery in July and conducted testmarketing<br />
ahead <strong>of</strong> our full-scale market entry. Along with these steps, we are<br />
developing strategies and building a distribution network in the country. In South<br />
Korea, we made a business alliance with Maeil Dairies Co., Ltd. in November and<br />
began beer sales there. Also in November, we entered a capital and business alliance<br />
with Kyodo Milk Industry Co., Ltd. for a project that will see both companies<br />
cooperate around production technology, R&D, raw material procurement and logistics.<br />
These measures will support both sales expansion and cost reductions going<br />
forward.<br />
Another accomplishment this term was the sale <strong>of</strong> Sapporo Breweries’ former<br />
Osaka Plant site and the Keiyo Physical Distribution Center, which generated ¥23.4<br />
billion in new investment resources. In parallel, we invested ¥10.0 billion in the acquisition<br />
and development <strong>of</strong> new properties in the Real Estate segment to secure future<br />
resources to support growth.<br />
SAPPORO HOLDINGS LIMITED<br />
<strong>Annual</strong> <strong>Report</strong> <strong>2010</strong><br />
07
SAPPORO GROUP MANAGEMENT PLAN 2011–2012<br />
Question 2<br />
How does the 2011–2012 Management Plan position this time period, and what target<br />
figures does it set out?<br />
Management Targets<br />
(¥ Billion)<br />
Net Sales<br />
(incl. alcohol taxes)<br />
Net Sales<br />
(excl. alcohol taxes)<br />
<strong>2010</strong><br />
Results<br />
2011<br />
Plan<br />
2012<br />
Plan<br />
2016<br />
Target<br />
389.2 482.0 519.5 600.0<br />
269.9 363.0 400.5 450.0<br />
Operating Income 15.4 18.0 20.0 40.0<br />
Net Income 10.8 6.0 8.0 –<br />
Answer 2<br />
Position <strong>of</strong> 2011–2012 Management Plans<br />
Guided by our management philosophy “To make people’s lives richer and<br />
more enjoyable,” we formulated the Sapporo Group New Management<br />
Framework (the New Management Framework) in October 2007. Under<br />
this long-term management policy, we have set ¥600.0 billion (including alcohol<br />
taxes) in net sales and ¥40.0 billion in operating income as management targets to<br />
reach by our 140th anniversary in 2016.<br />
In <strong>2010</strong>, we achieved a level <strong>of</strong> success in new measures for growth through<br />
Management Plan <strong>2010</strong>–2011, which was designed to help the Group transition to<br />
a growth phase. Building on this, in 2011 we drafted Management Plan 2011–<br />
2012 as a rolling plan that positions the two-year period as a time for solidifying<br />
our growth trajectory. By steadily implementing the plan, we will strive for further<br />
improvement in corporate value as we seek to achieve the goals <strong>of</strong> our New<br />
Management Framework.<br />
Position <strong>of</strong> SAPPORO Group Management Plan 2011–2012<br />
Solidify the growth trajectory to enable the SAPPORO Group’s dynamic future growth.<br />
Strengthening Group’s<br />
Business Foundations<br />
Solidifying the Growth Trajectory<br />
Dynamic Growth<br />
2007<br />
2007<br />
Groundwork for future growth<br />
strategies<br />
Bolster earnings base and<br />
financial base<br />
2011–2012<br />
Enhance existence value in new<br />
areas through growth strategies<br />
Build unique competitive<br />
advantages in each business<br />
Strategic Targets<br />
140th anniversary <strong>of</strong> Group’s<br />
founding (2016)<br />
2008 2009 <strong>2010</strong> 2011 2012 2013 2014 2015 2016<br />
Question 3<br />
What is your approach to this plan to solidify the Group’s growth trajectory, and what are<br />
some <strong>of</strong> the specific measures the Group will take?<br />
08<br />
SAPPORO HOLDINGS LIMITED<br />
<strong>Annual</strong> <strong>Report</strong> <strong>2010</strong><br />
Answer 3<br />
Solidify the Group’s Growth Trajectory<br />
There are two essentials to solidifying the Group’s growth trajectory. The<br />
first is to support top-line expansion through measures targeting growth<br />
drivers. The second is to ensure we secure the stable earnings we need<br />
for making ongoing strategic investment. Management Plan 2011–2012 sets the<br />
following three basic strategies for the Group:<br />
• Growth in new areas<br />
• Growth in all businesses<br />
• Bolster management capabilities that underpin growth
Business Expansion in S<strong>of</strong>t Drinks and Food<br />
For the first strategy, “growth in new areas,” we will strive to achieve definitive<br />
results that increase our presence and value in new areas identified in<br />
our growth strategy. This means ensuring we get definitive results from the<br />
strategic alliances and investment projects we have conducted in paving the way for<br />
growth over the years. A specific example is our business expansion in s<strong>of</strong>t drinks<br />
and food. In Japan, our decisive steps to attain sustainable growth have included<br />
forming an alliance with Marudai Food Co., Ltd. to invest in Azumino Food Co., Ltd.<br />
for the launch <strong>of</strong> a joint venture in yogurt, desserts and chilled s<strong>of</strong>t drinks, and our<br />
entry into Japan’s potato chip market. We also announced a capital and business<br />
alliance with Kyodo Milk Industry Co., Ltd. in November <strong>2010</strong>.<br />
With Kyodo Milk Industry, we are exploring future partnership opportunities in<br />
production technology, R&D, procurement and logistics, and in the s<strong>of</strong>t drinks business.<br />
Examples here include the use <strong>of</strong> our Ribbon Brand for Kyodo Milk Industry<br />
products, and leveraging Kyodo Milk Industry’s milk delivery routes to expand sales<br />
channels for Sapporo s<strong>of</strong>t drinks. Going forward, we will continue to use acquisitions<br />
and alliances to advance into new product areas in s<strong>of</strong>t drinks and food as a way to<br />
enter markets where we can leverage Sapporo Group capabilities and expertise.<br />
Aggressive Development in Asia<br />
Outside <strong>of</strong> Japan, we are paving the way for sustainable growth by entering<br />
the South Korean beer market through a capital alliance with local company<br />
Maeil Dairies Co., Ltd. We also entered the Vietnamese beer<br />
market and plan to advance into other Asian countries with the construction <strong>of</strong> a<br />
new brewery and other efforts.<br />
In South Korea, while the domestic beer market is maturing, the imported beer<br />
category has grown rapidly, expanding about two-fold since 2005. Another key<br />
feature is that the commercial-use sector is large relative to that <strong>of</strong> Japan, accounting<br />
for roughly 50% <strong>of</strong> the South Korean beer market. To commence with full-scale<br />
beer sales in South Korea, we entered an alliance with Maeil Dairies, a major dairy<br />
industry manufacturer boasting top shares for cheese and chilled cup c<strong>of</strong>fee in<br />
South Korea. Utilizing the company’s robust sales network will raise the pr<strong>of</strong>ile <strong>of</strong><br />
the Sapporo brand as we move to consolidate our Asia strategy. Exports <strong>of</strong> Sapporo<br />
brand products to South Korea have been underway since December <strong>2010</strong>, and<br />
sales to convenience stores, supermarkets and restaurant chains through Maeil<br />
Dairies’ sales network have been expanding ever since. Sales <strong>of</strong> Sapporo products<br />
have also begun at restaurants directly operated by Maeil Dairies.<br />
In 2011, which marks the full-scale start <strong>of</strong> sales in South Korea, we are projecting<br />
sales <strong>of</strong> 300,000 cases*, with growth to 1.5 million cases by 2015, as we<br />
strive to become South Korea’s No. 1 imported beer brand.<br />
*One case is equivalent to 24 bottles (350ml each).<br />
SAPPORO HOLDINGS LIMITED<br />
<strong>Annual</strong> <strong>Report</strong> <strong>2010</strong><br />
09
Question 4<br />
Can you elaborate on the second point, concerning growth in all businesses?<br />
Answer 4<br />
Growth in All Businesses<br />
We want to realize additional growth in all businesses to create a more<br />
robust Group base. Specifically, we intend to further promote previous<br />
strategies, for example, strengthening our brands by channeling management<br />
resources into core products in the Alcoholic Beverages (Japan) business.<br />
In this business, we will find sustainable growth by looking beyond customer satisfaction<br />
to evoke an active emotional response in customers. In the Restaurants business,<br />
we will move more aggressively to develop Yebisu Bar, a strong-performing new<br />
restaurant format that draws on synergies with Sapporo Breweries Ltd. In the Real<br />
Estate business, our task is to maintain and enhance our stable earnings structure<br />
by improving the value <strong>of</strong> prime properties in our portfolio. Please see page 16,<br />
Review <strong>of</strong> Operations for a more in-depth look at measures in each business.<br />
Question 5<br />
Please talk a bit more about your third basic strategy, bolstering management capabilities<br />
that underpin growth.<br />
Answer 5<br />
Bolster Management Capabilities that Underpin Growth<br />
As we promote growth strategies, the Group’s business domains are<br />
expanding. Given this trend, we decided that our management structure<br />
must have the functions and organizations in place to respond to the<br />
Group’s growth. Against this backdrop, we are reviewing our group headquarters<br />
organization. Our purpose here is to develop a functional structure capable <strong>of</strong><br />
enhancing our capabilities for planning, proposing and promoting growth strategies.<br />
One specific measure we will take is to divide up the group headquarters functions<br />
<strong>of</strong> the holding company Sapporo Holdings Ltd. We will transfer highly specialized<br />
functions and pr<strong>of</strong>essional operations common to all operating companies to<br />
Sapporo Group Management Co., Ltd. (formerly Sapporo Pro Assist Co., Ltd.). After<br />
the transfer, the new Sapporo Holdings will specialize in the planning and promotion<br />
<strong>of</strong> Group growth strategies, as well as financing and auditing functions. This<br />
change will enhance organizational flexibility and strengthen our ability to promote<br />
growth strategies across the entire Sapporo Group. Sapporo Group Management<br />
will serve together with Sapporo Holdings as an organization responsible for group<br />
headquarters functions. It will chart the best course from the perspective <strong>of</strong> the<br />
entire group with respect to proper business execution, specialized human capital<br />
development, operating company support, and improvements in cost efficiency that<br />
leverage economies <strong>of</strong> scale.<br />
10<br />
SAPPORO HOLDINGS LIMITED<br />
<strong>Annual</strong> <strong>Report</strong> <strong>2010</strong>
Question 6<br />
Please describe some <strong>of</strong> the investments the Group has made to support these growth<br />
strategies you have mentioned.<br />
Answer 6<br />
Basic Approach to Strategic Investment<br />
In addition to contributions from increased earnings from all business segments,<br />
in <strong>2010</strong>, we generated ¥23.4 billion for new investment resources from the sale<br />
<strong>of</strong> Sapporo Breweries’ former Osaka Plant site and the Keiyo Physical<br />
Distribution Center. Going forward, our policy is to encourage effective asset utilization<br />
and earnings expansion from existing businesses. For 2011, we envisage<br />
making strategic investments totaling ¥63.5 billion, including ordinary capital investment,<br />
mainly from the acquisition <strong>of</strong> shares in POKKA CORPORATION and plant construction<br />
in Vietnam. Moreover, our aggressive investment in growth strategies will<br />
continue beyond 2012. Between 2012 and 2016 we are estimating strategic investment<br />
<strong>of</strong> around ¥150 billion to ¥200 billion, including ordinary capital investment.<br />
Question 7<br />
How did the Group’s management integration with former capital and business alliance<br />
partner POKKA Corporation unfold and what is the post-integration outlook?<br />
2011–2012 Management Targets<br />
(¥ Billion)<br />
<strong>2010</strong><br />
Results<br />
2011<br />
Plan<br />
2012<br />
Plan<br />
Net Sales (incl. alcohol taxes) 389.2 482.0 519.5<br />
Alcoholic Beverages (Japan) 279.3 286.7 290.6<br />
Alcoholic Beverages (International) 25.4 29.2 32.2<br />
S<strong>of</strong>t Drinks 33.9 37.4 39.8<br />
POKKA Group – 78.9 103.9<br />
Restaurants 26.4 25.5 26.3<br />
Real Estate 23.5 23.0 24.7<br />
Other 0.6 1.3 2.0<br />
Operating Income (Loss) 15.4 18.0 20.0<br />
Alcoholic Beverages (Japan) 9.2 9.8 10.6<br />
Alcoholic Beverages (International) 0.5 0.1 0.3<br />
S<strong>of</strong>t Drinks 1.3 0.7 0.7<br />
POKKA Group – 2.3 2.4<br />
Restaurants 0.2 0.4 0.6<br />
Real Estate 8.0 8.3 9.0<br />
Other (0.7) (0.4) (0.3)<br />
Corporate (3.0) (3.2) (3.3)<br />
Net Income 10.8 6.0 8.0<br />
Answer 7<br />
Management Integration with POKKA CORPORATION<br />
We concluded a capital and business alliance with POKKA<br />
CORPORATION in September 2009. This move proved successful in<br />
numerous ways. Among other benefits, it strengthened our hand in the<br />
vending machine business, reduced costs through joint procurement, spurred production<br />
system optimization, and enabled joint business development in overseas<br />
markets. At the same time, this cooperation fostered mutual bonds <strong>of</strong> trust.<br />
Eventually, we determined that developing a corporate group that merges both<br />
companies would be the best option for taking this capital and business alliance<br />
relationship to its next logical stage and ramping up the pace <strong>of</strong> cooperation. After<br />
integrating their management the two companies will work together to promote business.<br />
I believe this unified stance will allow the new group to overcome the recent<br />
severity <strong>of</strong> the market environment and establish a more powerful presence. We are<br />
currently discussing options for making this the start <strong>of</strong> a new structure for building<br />
a food value creation group with rich competitive strengths across the alcoholic<br />
beverages, s<strong>of</strong>t drinks, food, and restaurant fields here in Japan and overseas.<br />
SAPPORO HOLDINGS LIMITED<br />
<strong>Annual</strong> <strong>Report</strong> <strong>2010</strong><br />
11
Feature 1: Vietnam Brewery Operation<br />
Poised for Growth<br />
in Vietnam...Asia<br />
Vietnam Plant Comes Onstream<br />
6,800,000kl<br />
Consumption <strong>of</strong><br />
Beer in Vietnam<br />
780,000<br />
1,460,000 1,650,000 1,850,000<br />
00 05 06 07 25<br />
(forecast)<br />
2025 forecast by the Ministry <strong>of</strong> Industry and Trade <strong>of</strong> Vietnum.<br />
SAPPORO HOLDINGS LIMITED<br />
12 <strong>Annual</strong> <strong>Report</strong> <strong>2010</strong>
With growth continuing at around 10% per year,<br />
the Vietnam beer market is full <strong>of</strong> promise.<br />
The Sapporo Group is the first Japanese beer<br />
maker to start construction <strong>of</strong> a brewery in Vietnam, and is<br />
currently test marketing in preparation for a full scale entry<br />
into the market in 2012. Through this early-bird approach,<br />
we plan to establish the Sapporo brand in Vietnam and<br />
quickly capture market share, before expanding our<br />
business further afield in the wider Asian markets.<br />
Image <strong>of</strong> the completed brewery<br />
Background to the Joint Venture<br />
The Vietnamese beer market is currently<br />
Asia’s third largest, after China and Japan.<br />
<strong>Annual</strong> beer consumption is about one third<br />
<strong>of</strong> Japan’s, standing at around 2 million<br />
kiloliters, but demand is growing each<br />
year. The Ministry <strong>of</strong> Industry and Trade <strong>of</strong><br />
Vietnam forecasts that by 2025 beer<br />
consumption will reach 6.8 million kiloliters<br />
per year, making vietnam one <strong>of</strong> the chief<br />
beer consuming nations in the world.<br />
The Sapporo Group had been pursuing<br />
the beer business in Vietnam in a<br />
strategic alliance with the Vietnamese<br />
state-owned tobacco company, Vietnam<br />
National Tobacco Corporation (VINATABA),<br />
since 2009. To this end, we acquired an<br />
interest in a joint venture to establish it<br />
as a consolidated subsidiary, SAPPORO<br />
VIETNAM LIMITED. The company has been<br />
importing and selling beer under its new<br />
management framework in the<br />
vietnamese market since <strong>2010</strong>. VINATABA<br />
is a large state-run enterprise under direct<br />
supervision <strong>of</strong> the <strong>of</strong>fice <strong>of</strong> the prime<br />
minister with operations including production<br />
and sale <strong>of</strong> tobacco, food, and beverages.<br />
It has a solid track record in Vietnam<br />
and enjoys a high level <strong>of</strong> public trust.<br />
Future Plans<br />
The brewery we are building is located in<br />
the province <strong>of</strong> Long An, a suburb <strong>of</strong> Ho<br />
Chi Minh City. Operations are scheduled<br />
to commence in fall <strong>of</strong> 2011, along with<br />
the first shipments to the Vietnamese<br />
market. The Sapporo Group views this<br />
full scale entry into the Vietnamese<br />
market as a launching pad for further<br />
expansion into other Asian markets in the<br />
future. The Group is targeting annual<br />
sales volume <strong>of</strong> 150,000 kiloliters and<br />
sales <strong>of</strong> US$128 million by 2019.<br />
Outline <strong>of</strong><br />
SAPPORO VIETNAM LIMITED<br />
Location:<br />
Viet Hoa—Duc Hoa III Industrial Zone,<br />
Duc Lap Ha Ward, Duc Hoa District,<br />
Long An Province, Vietnam<br />
Representative:<br />
President Hir<strong>of</strong>umi Kishi<br />
Business activities:<br />
Manufacture <strong>of</strong> beer, wholesaling <strong>of</strong><br />
alcoholic beverages<br />
Capital:<br />
708,595 million Vietnamese dong<br />
Establishment:<br />
February 1, 2007<br />
Shareholder ratios:<br />
Sapporo Holdings 71%, VINATABA 29%<br />
SAPPORO HOLDINGS LIMITED<br />
<strong>Annual</strong> <strong>Report</strong> <strong>2010</strong> 13
Feature 2: Management Integration With POKKA CORPORATION<br />
POKKA Joins<br />
the SAPPORO Group<br />
Operating Income<br />
(¥ Billion)<br />
¥15.4<br />
¥20.0<br />
¥9.0<br />
¥0.2<br />
¥1.3<br />
¥0.5<br />
¥8.0<br />
¥0.6<br />
¥0.7<br />
¥0.3<br />
POKKA ¥2.4<br />
¥9.2<br />
¥10.6<br />
¥(0.7)<br />
¥(3.0)<br />
¥(0.3)<br />
¥(3.3)<br />
<strong>2010</strong> 2012<br />
(Target)<br />
¥2.0 ¥24.7<br />
¥26.3<br />
Net Sales<br />
(¥ Billion)<br />
¥23.5<br />
¥0.6<br />
¥26.4<br />
POKKA<br />
¥103.9<br />
2012<br />
Total ¥519.5<br />
(Target)<br />
¥290.6<br />
¥33.9<br />
¥25.4<br />
<strong>2010</strong><br />
Total ¥389.2<br />
¥279.3<br />
¥39.8<br />
¥32.2<br />
■ Japanese Alcoholic Beverages ■ International Alcoholic Beverages ■ S<strong>of</strong>t Drinks ■ POKKA ■ Restaurants ■ Real Estate ■ Other Business ■ Corporate<br />
Information in the graph for <strong>2010</strong> has been restated here following a change in the structure <strong>of</strong> segments. (See page 57).<br />
14<br />
SAPPORO HOLDINGS LIMITED<br />
<strong>Annual</strong> <strong>Report</strong> <strong>2010</strong>
In March 2011 Sapporo Holdings acquired 85% <strong>of</strong> the shares <strong>of</strong> POKKA<br />
CORPORATION, making it a member <strong>of</strong> the Sapporo Group. This move has<br />
allowed the Sapporo Group to reinforce its S<strong>of</strong>t Drinks and Food business to<br />
balance its earnings sources from its Alcoholic Beverages and Real Estate<br />
businesses. At the same time, consolidated net sales rose in excess <strong>of</strong> ¥500 billion.<br />
A capital and operational alliance made with POKKA CORPORATION in 2009<br />
produced synergies worth ¥500 million through optimized production systems,<br />
joint purchasing operations, shared use <strong>of</strong> vending machines and other strategies<br />
in Japan, as well as international expansion for the Sapporo Group using POKKA<br />
CORPORATION (Singapore) Pte Ltd.’s sales channels. We expect the recent<br />
management integration to produce even greater synergy benefits. (The targets in<br />
the graph do not include our forecast figures for synergy benefits).<br />
POKKA CORPORATION<br />
Strengths<br />
1. Strengths in the Beverages and Food<br />
businesses<br />
• Strong market share in beverages containing<br />
lemon juice and soups<br />
Lemon-based products: No. 1 in homeuse<br />
market<br />
Soup: No. 2 market share in Japan<br />
2. Expansion Capability in Asia<br />
• Among POKKA CORPORATION’s flagship<br />
tea-based beverages, its green tea<br />
products have around 70% <strong>of</strong> the<br />
market in Singapore, demonstrating the<br />
company’s unrivaled brand recognition<br />
in Asia.<br />
• POKKA CORPORATION operates various<br />
restaurants in Hong Kong and Singapore.<br />
3. Number <strong>of</strong> Vending Machines<br />
• Vending machines are a key sales channel<br />
covering about 30% <strong>of</strong> the s<strong>of</strong>t<br />
drinks market in Japan<br />
• POKKA CORPORATION has about<br />
90,000 vending machines, which added<br />
to those <strong>of</strong> Sapporo make a total <strong>of</strong><br />
about 120,000 available vending<br />
machines<br />
Focus Themes<br />
1. Accelerate International Expansion<br />
• Accelerate expansion in Asia where both<br />
companies are strong<br />
• Boost the proportion <strong>of</strong> overseas sales<br />
to total revenue<br />
2. Strengthening Complementary<br />
Businesses Domestically<br />
• Enhance complementary aspects <strong>of</strong> s<strong>of</strong>t<br />
drink operations<br />
• Expand the food business<br />
• Expand the restaurants business<br />
3. Combine R&D and Technological<br />
Innovations to Create New Value<br />
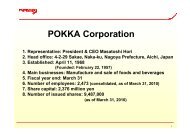
Outline <strong>of</strong><br />
POKKA CORPORATION<br />
Head <strong>of</strong>fice:<br />
4-2-29 Sakae, Naka-ku, Nagoya, Aichi,<br />
Japan<br />
Representative:<br />
President & CEO Masatoshi Hori<br />
Established:<br />
April 11, 1968<br />
(Founded: February 22, 1957)<br />
Main businesses:<br />
Manufacture and sale <strong>of</strong> foods and<br />
beverages<br />
Number <strong>of</strong> employees<br />
(consolidated, as <strong>of</strong> March 31, <strong>2010</strong>):<br />
2,473<br />
Capital:<br />
¥2,376 million<br />
Number <strong>of</strong> issued shares<br />
(as <strong>of</strong> March 31, <strong>2010</strong>):<br />
9,487,000<br />
Net sales<br />
¥97,121 million (FY <strong>2010</strong>/3)<br />
Total assets<br />
¥58,527 million (FY <strong>2010</strong>/3)<br />
From left: Lemon-based product, C<strong>of</strong>fee, Soup<br />
CAFÉ de CRIÉ<br />
SAPPORO HOLDINGS LIMITED<br />
<strong>Annual</strong> <strong>Report</strong> <strong>2010</strong> 15
Performance Review and Plan<br />
(Performance review figures are based on the segment structure prior to reorganization in <strong>2010</strong>.<br />
Plan figures relate to the new post-reorganization structure)<br />
Alcoholic Beverages (Japan)<br />
Sapporo Breweries Ltd.<br />
The Japanese beer and beer-type beverages market saw total<br />
demand decrease by an estimated 2% year on year. By genre,<br />
while demand for beer and happo-shu (low-malt beer) declined,<br />
demand for new product genres grew by 10% as the shift in consumption<br />
to lower-priced products continues. Against this backdrop, net sales in<br />
our Alcoholic Beverages (Japan) business declined by ¥4.1 billion, or<br />
1.4%, to ¥278.8 billion. In contrast, operating income rose ¥1.8 billion, or<br />
24.3%, to ¥9.3 billion. Income growth reflected increased earnings atop<br />
higher sales volume in beer, coupled with reductions in manufacturing<br />
costs. These factors outweighed increased depreciation expenses from<br />
the transition to a new sales and logistics system.<br />
From left: Sapporo Draft Beer Black Label, Yebisu, Mugi to Hop<br />
Beer Business<br />
In the beer business, we conducted marketing activities centered<br />
around our core brands Yebisu Beer, Sapporo Draft Beer Black<br />
Label, and Mugi to Hop. Our overall sales volume for beer rose<br />
0.8% over the previous fiscal year.<br />
In beer, Sapporo Draft Beer Black Label made particularly firm<br />
gains in the home-use market. The Yebisu brand, which recently<br />
celebrated its 120th anniversary, saw overall sales volume rise<br />
3.0% year on year, as Yebisu Silk attracted women and other new<br />
customers during its first full-year <strong>of</strong> sales. As a result, our beer<br />
sales volume declined just 2.8%, compared to a contraction <strong>of</strong><br />
around 4% in overall beer demand.<br />
In new product genres, a jump <strong>of</strong> 11.5% in sales volume outpaced<br />
growth in overall new product genre demand. Notably, Mugi<br />
to Hop, now in its third year <strong>of</strong> sales, grew by 23.5% year on year,<br />
for a second consecutive year <strong>of</strong> growth above 20%. Contributions<br />
also came from Sapporo Creamy White, which was launched in<br />
September.<br />
In ready-to-drink (RTD) beverages, Nectar Sour Sparkling Peach<br />
won strong support particularly from young women for its originality<br />
and flavor, resulting in higher-than-expected sales volume.<br />
Shochu Business<br />
Shochu (Japanese distilled spirits) sales volume grew despite a<br />
struggling market for wheat-based shochu. The growth reflected the<br />
strong reputation <strong>of</strong> our singly distilled shochu <strong>of</strong>ferings. Among<br />
them Waramugi was declared a grand prize winner in the “Singly<br />
Distilled Shochu” category by the Alcohol Appreciation and Evaluation<br />
Committee <strong>of</strong> the Fukuoka Regional Taxation Bureau. As price<br />
competition heats up in the multiply distilled, large-volume product<br />
market, we have been able to maintain operating income despite<br />
lower sales overall in shochu year on year. This is largely thanks to<br />
our efforts launched two years ago to reform the earnings structure<br />
in this business, mainly by eliminating unpr<strong>of</strong>itable products.<br />
Wine Business<br />
In imported wine, sales were firm for the Yellow Tail series <strong>of</strong><br />
wines, which introduced Moscato as a new product. Turning to<br />
Net Sales<br />
(¥ Million)<br />
Operating Income<br />
(¥ Million)<br />
domestic wines, while a strong reputation for quality translated<br />
400,000<br />
10,000<br />
into growth for our Grande Polaire series <strong>of</strong> premium wines made<br />
from 100% domestic grapes, contraction in the domestic wine<br />
300,000<br />
7,500<br />
market and other factors led overall sales in wine business to<br />
200,000<br />
5,000<br />
decline. Wine business earnings, however, grew for a fourth consecutive<br />
year.<br />
100,000<br />
0<br />
315,893<br />
07<br />
299,699<br />
08<br />
282,914<br />
09<br />
278,832<br />
10<br />
2,500<br />
0<br />
6,189<br />
07<br />
7,709<br />
08<br />
7,483<br />
09<br />
9,303<br />
10<br />
16<br />
SAPPORO HOLDINGS LIMITED<br />
<strong>Annual</strong> <strong>Report</strong> <strong>2010</strong>
Management Plan 2011–2012<br />
Management Targets<br />
(¥ Billion)<br />
<strong>2010</strong> results 2011 targets 2012 targets<br />
Net Sales 279.3 286.7 290.6<br />
Operating Income 9.2 9.8 10.6<br />
To achieve sustained growth, we will aim to provide the greatest<br />
excitement and joy to customers in the beer, wine, shochu, and<br />
RTD (ready-to-drink) sectors while implementing structural reforms<br />
and working vigorously to achieve our sales and pr<strong>of</strong>it targets.<br />
Key Points<br />
1. Bolster alcoholic-beverage marketing<br />
We will endeavor to maintain the previous year’s momentum<br />
and increase sales by winning additional customer support<br />
using a select-and-focus approach (selectively focusing<br />
resources on key areas).<br />
(1) Enhancing brand power by focusing resources on core<br />
products<br />
• We will enhance our presence in the beer and new product<br />
genre markets by strategically focusing resources on<br />
Yebisu, Sapporo Draft Beer Black Label, and Mugi to<br />
Hop, which account for three-quarters <strong>of</strong> case sales.<br />
(2) Laying the groundwork for growth in expanding areas<br />
• To lay the groundwork for growth we will <strong>of</strong>fer products<br />
that embody Sapporo’s strengths in the non-alcoholic<br />
beer market, which we expect to expand in line with<br />
market changes, and in the market for RTD beverages,<br />
which are highly substitutable for home-use beers.<br />
(3) Expansion <strong>of</strong> the wine and shochu sectors<br />
• Over the medium term, we intend to expand our non-beer<br />
alcoholic beverages operations, which include RTD beverages,<br />
to a scale capable <strong>of</strong> generating annual operating<br />
income <strong>of</strong> ¥2.0 billion. We will do this by boosting brand<br />
power and <strong>of</strong>fering innovative value propositions.<br />
2. Strengthening the operating base<br />
• To achieve our financial targets, we will implement<br />
management-driven projects to resolve issues, especially<br />
with respect to critically important cross-organizational priorities<br />
such as cost structure reforms and organizational<br />
strengthening.<br />
• In cost structure reforms in particular, our activities will be<br />
directed at achieving ¥3.0 billion in cost reductions from<br />
2011 to 2013.<br />
Note: All Management Plan figures are derived from a simplified segment classification method based on the management approach.<br />
SAPPORO HOLDINGS LIMITED<br />
<strong>Annual</strong> <strong>Report</strong> <strong>2010</strong><br />
17
Performance Review and Plan<br />
Alcoholic Beverages (International)<br />
Sapporo International Inc.<br />
In the North American beer market, total demand was estimated to<br />
have contracted by some 1–2% as consumer spending remained<br />
weak despite emerging signs <strong>of</strong> recovery. Meanwhile, the beer<br />
market in rapidly growing Asia continued to expand steadily. Given this<br />
context, in the Alcoholic Beverages (International) business we focused<br />
on sales activities targeting the premium-price range market, where<br />
Sapporo has a strong presence. Consequently, net sales rose ¥2.8 billion,<br />
or 12.4%, year on year to ¥25.4 billion. However, due to upfront investment<br />
in vietnam, among other factors, operating income declined ¥0.2<br />
billion, or 27.7%, to ¥0.5 billion.<br />
Sapporo brand and SLEEMAN brand<br />
North American Market<br />
Sales volume at Canadian subsidiary SLEEMAN BREWERIES LTD.<br />
(excluding outsourced production <strong>of</strong> Sapporo brand products) rose<br />
by 5%—a fourth consecutive term <strong>of</strong> year-on-year sales volume<br />
growth. Similarly, growth in Sapporo brand sales volume was up<br />
13% year on year at Sapporo U.S.A., Inc.<br />
Asian Market<br />
Sales volume outside <strong>of</strong> North America, most notably in Asia,<br />
rose 24% over the previous year.<br />
In Vietnam, where we commenced full-scale business development<br />
in December 2009, we began construction on a brewery in<br />
July ahead <strong>of</strong> our joint venture in local beer production and sales<br />
with state-owned company Vinataba. In conjunction, we made<br />
progress with establishing a marketing strategy, building a distribution<br />
network, and other preparations. In the Singapore market,<br />
we sought to expand our sales channels in the home-use market<br />
this term through cooperation with POKKA CORPORATION. We<br />
also announced our full-scale reentry into beer sales directed at<br />
the home and commercial-use sectors in the South Korean market.<br />
Net Sales<br />
(¥ Million)<br />
Operating Income<br />
(¥ Million)<br />
30,000<br />
2,000<br />
20,000<br />
1,500<br />
1,000<br />
10,000<br />
500<br />
0<br />
27,777<br />
07<br />
25,021<br />
08<br />
22,582<br />
09<br />
25,386<br />
10<br />
0<br />
1,665<br />
07<br />
901<br />
08<br />
693<br />
09<br />
502<br />
10<br />
18<br />
SAPPORO HOLDINGS LIMITED<br />
<strong>Annual</strong> <strong>Report</strong> <strong>2010</strong>
Management Plan 2011–2012<br />
Management Targets<br />
(¥ Billion)<br />
<strong>2010</strong> results 2011 targets 2012 targets<br />
Net Sales 25.4 29.2 32.2<br />
Operating Income 0.5 0.1 0.3<br />
To build our corporate brand and expand the scope <strong>of</strong> our business<br />
activities overseas, we will step up activities and expand<br />
into business categories other than alcoholic beverages,<br />
making North America and Asia our top- priority areas. Thus,<br />
we aim to shift from the Alcoholic Beverages (International)<br />
business to a broader international business.<br />
Key Points<br />
1. Growing our North American business<br />
(1) Marketing strategies<br />
• SLEEMAN BREWERIES LTD. will continue to strive for<br />
growth above the market average through further investment<br />
in marketing <strong>of</strong> premium brands.<br />
• Sapporo U.S.A. will continue to position itself for additional<br />
growth by expanding its focus beyond the<br />
Japanese-American community to encompass the wider<br />
American and Asian-American markets.<br />
• We will also consider mergers, acquisitions, and alliances<br />
for further business expansion in the U.S.<br />
(2) Bolstering production capabilities<br />
• To accommodate future sales growth, we intend to establish<br />
an optimal production structure across North America<br />
by conducting a review <strong>of</strong> production systems at<br />
SLEEMAN BREWERIES LTD. and considering production<br />
facilities expansion, consignment production, and M&A<br />
activities.<br />
(3) Cost structure reforms<br />
• At SLEEMAN BREWERIES LTD., we will strive for further<br />
improvements in product quality and cost efficiency by<br />
implementing quality control, process stabilization, and<br />
SKU (stock-keeping unit) reduction.<br />
2. Expanding into the Asian market<br />
(1) Operations in Vietnam<br />
• In 2011, we will continue brewery construction with completion<br />
scheduled for fall while also strengthening our<br />
marketing operations through ongoing test- marketing and<br />
development <strong>of</strong> a distribution network.<br />
• In 2012, we will launch a marketing program that<br />
includes media advertising and go into full-swing with<br />
sales as we attempt to quickly capture market share and<br />
establish the Sapporo brand in Vietnam.<br />
• We will also endeavor to expand Sapporo brand sales in<br />
countries surrounding Vietnam.<br />
(2) Other business development in Asia<br />
• In Singapore, we will continue to expand our sales channels<br />
and enter the home-use market in cooperation with<br />
POKKA CORPORATION.<br />
• In South Korea, a market that we reentered late last<br />
year, we will begin full-scale beer sales through the sales<br />
network <strong>of</strong> alliance partner Maeil Dairies Co., Ltd., a<br />
major South Korean dairy goods manufacturer.<br />
3. Activities to expand the scope <strong>of</strong> business<br />
• While making the alcoholic beverage business our core business,<br />
we will continue to pursue activities in new businesses<br />
in which we can demonstrate group synergies, including<br />
mergers, acquisitions, and alliances.<br />
Note: All Management Plan figures are derived from a simplified segment classification method based on the management approach.<br />
SAPPORO HOLDINGS LIMITED<br />
<strong>Annual</strong> <strong>Report</strong> <strong>2010</strong><br />
19
Performance Review and Plan<br />
S<strong>of</strong>t Drinks<br />
Sapporo Beverage Co., Ltd.<br />
Overall demand in the Japanese s<strong>of</strong>t drinks market<br />
was estimated to have grown by around 3% year<br />
on year, despite the impact <strong>of</strong> the economic<br />
downturn in the first half. Growth is thought to have come<br />
primarily from increased demand stemming from recordhigh<br />
summer temperatures in Japan from July to<br />
September. In our S<strong>of</strong>t Drinks business, we embarked on a<br />
brand building growth strategy and took action to improve<br />
the operating margin. These efforts lifted both sales and<br />
income, with net sales climbing ¥3.7 billion, or 12.0%, year<br />
on year to ¥34.4 billion, while operating income increased<br />
¥0.2 billion, or 74.8%, to ¥0.5 billion.<br />
S<strong>of</strong>t Drinks<br />
In terms <strong>of</strong> sales and marketing, we focused mainly on cultivating<br />
and strengthening our brands by concentrating our sales capabilities<br />
on core brand products and investing in marketing. For<br />
Ribbon and Gabunomi series products, we worked to develop<br />
consumer campaigns and in-store sales promotion measures. For<br />
Gerolsteiner naturally carbonated water from Germany, our initiatives<br />
included large-scale test sampling, TV commercials and<br />
consumer campaigns in major cities. Contributions to sales also<br />
came from new products, including So No Mama Zukuri fruit<br />
juices, which capture real fruit flavor ‘just as it is’ for consumers<br />
to enjoy. Together, these factors lifted sales volume 2% higher<br />
than the previous year.<br />
60,000<br />
40,000<br />
20,000<br />
Turning to costs, in<br />
addition to creating synergies<br />
with alliance partner<br />
POKKA CORPORATION, we<br />
promoted cost-structure<br />
reforms across the entire<br />
value chain and sought to From left: Ribbon Citron, Gerolsteiner<br />
maximize pr<strong>of</strong>its in a bid to<br />
build a stable earnings base. Specific efforts included production<br />
system optimization, procurement cost reductions, and fewer<br />
inventory disposal losses.<br />
Foods Business<br />
In the Foods business, we extended the sales area for our Sapporo<br />
Potekaru non-oil-fried potato chips nationwide (excluding<br />
Okinawa), and increased our product lineup to seven varieties as<br />
part <strong>of</strong> sales expansion efforts.<br />
Net Sales<br />
(¥ Million)<br />
0<br />
52,239<br />
07<br />
36,849<br />
08<br />
30,746<br />
09<br />
34,439<br />
10<br />
Operating Income (Loss)<br />
(¥ Million)<br />
1,000<br />
500<br />
0<br />
–500<br />
–1,000<br />
–839<br />
07<br />
221<br />
08<br />
301<br />
09<br />
526<br />
10<br />
Management Plan 2011–2012<br />
Management Targets<br />
S<strong>of</strong>t Drinks Business<br />
<strong>2010</strong> results 2011 targets 2012 targets<br />
Net Sales 33.9 37.4 39.8<br />
Operating Income 1.3 0.7 0.7<br />
Key Points<br />
(¥ Billion) Other Businesses (Foods)<br />
(¥ Billion)<br />
<strong>2010</strong> results 2011 targets 2012 targets<br />
Net Sales 0.6 1.3 2.0<br />
Operating Income (Loss) (0.7) (0.4) (0.3)<br />
S<strong>of</strong>t Drinks<br />
1. Marketing strategies<br />
Enhancing our brand power<br />
• We intend to strengthen our brand power by concentrating marketing investment<br />
and sales efforts on core brand products.<br />
• We will also work to improve our product development infrastructure with an<br />
eye to the creation <strong>of</strong> new high-value-added products.<br />
2. Cost structure reforms<br />
Implementing our cost structure reform program<br />
• We will implement cost structure reforms throughout the entire value chain<br />
using a select-and-focus approach (selectively focusing resources on key areas).<br />
Other Businesses<br />
1. Expanding our confectionery business (Sapporo Fine Foods Co., Ltd.)<br />
• With regard to the Potekaru range, we intend to expand sales by such<br />
means as developing and introducing new products based on new ingredients<br />
and new concepts. As we develop the product line, we will control<br />
costs by using an efficient production system.<br />
2. Developing our yogurt, dessert, and chilled beverages business<br />
(Azumino Food Co., Ltd, *Equity-method affiliate)<br />
• In addition to increasing sales <strong>of</strong> existing products, we will aim to develop<br />
and launch functional yogurt made using Sapporo Breweries’ lactobacillus,<br />
establish the product in the market, and increase sales.<br />
Note: All Management Plan figures are derived from a simplified segment classification method based on the management approach.<br />
20<br />
SAPPORO HOLDINGS LIMITED<br />
<strong>Annual</strong> <strong>Report</strong> <strong>2010</strong>
Performance Review and Plan<br />
Restaurants<br />
Sapporo Lion Ltd.<br />
In the Japanese restaurant industry, the operating<br />
environment remained as severe as ever. Cut-price<br />
competition intensified amid a drop in restaurant<br />
dining frequency, triggered mainly by growing consumer<br />
frugality. In our Restaurants business, we closed unpr<strong>of</strong>itable<br />
restaurant locations as part <strong>of</strong> earnings structure<br />
reforms and opened new locations in new formats, to end<br />
the year with 202 locations. As a result, net sales<br />
declined by ¥1.0 billion, or 3.5%, year on year to ¥27.1<br />
billion, while operating income rose ¥0.3 billion from the<br />
previous year to ¥0.1 billion.<br />
Existing Restaurants<br />
In an attempt to restore customer traffic at existing restaurants,<br />
we took several measures to set our locations apart from competitors,<br />
including campaigns around draft beer varieties, a campaign<br />
commemorating the 111th anniversary <strong>of</strong> the Sapporo Lion Beer<br />
Hall chain’s inception, and menus featuring seasonal fare. We<br />
also stepped up sales activities directed at corporate customers in<br />
order to stimulate demand for banquet reservations. In parallel,<br />
we made progress in earnings structure reform, worked to bring<br />
costs down, including by petitioning for lower leasing fees for our<br />
restaurants, and closed 14 unpr<strong>of</strong>itable locations.<br />
New Restaurants<br />
In new openings, in January we opened a second location in our<br />
Yebisu Bar chain and a Brasserie Ginza Lion location at Kasumigaseki<br />
Common Gate. Yebisu Bar is a new format we developed<br />
by tapping into Group synergies. This was followed in July with<br />
another Brasserie Ginza Lion opening in Yaesu Chikagai, Tokyo<br />
Station, and the opening <strong>of</strong> a Beer Restaurant Ginza Lion location<br />
inside the New Chitose Airport Terminal, Hokkaido.<br />
Net Sales<br />
(¥ Million)<br />
30,000<br />
20,000<br />
10,000<br />
0<br />
28,954<br />
07<br />
29,538<br />
08<br />
28,026<br />
09<br />
From left: Sapporo Lion Beer Hall in Ginza<br />
7-chome, Tokyo; Yebisu Bar in Umeda, Osaka<br />
27,051<br />
10<br />
Operating Income (Loss)<br />
(¥ Million)<br />
800<br />
600<br />
400<br />
200<br />
0<br />
–200<br />
656<br />
07<br />
551<br />
08<br />
–172<br />
09<br />
109<br />
10<br />
Management Plan 2011–2012<br />
Management Targets<br />
<strong>2010</strong> results 2011 targets 2012 targets<br />
Net Sales 26.4 25.5 26.3<br />
Operating Income 0.2 0.4 0.6<br />
Key Points<br />
(¥ Billion)<br />
1. Positioning for growth<br />
(1) Measures for existing restaurants<br />
• To increase customer traffic, we will continue to conduct<br />
promotional campaigns and boost sales activities<br />
directed at corporate customers.<br />
(2) New restaurant opening strategy<br />
• In 2011, we plan to open new restaurants totaling<br />
around 1,653 square meters in size.<br />
We will work to invigorate existing restaurants and develop<br />
formats differentiated from the competition. We will also<br />
undertake cost structure reforms from a medium-term perspective<br />
to enable the business to weather economic change.<br />
• We will roll out the new Yebisu Bar format that takes<br />
advantage <strong>of</strong> synergies with Sapporo Breweries Ltd.<br />
2. Cost structure reforms<br />
• We will implement cost structure reforms by closing<br />
unpr<strong>of</strong>itable restaurants (six closures are planned in<br />
2011) and reducing rent and other fixed costs while at<br />
the same time controlling personnel expenses through<br />
tighter work-shift management.<br />
Note: All Management Plan figures are derived from a simplified segment classification method based on the management approach.<br />
SAPPORO HOLDINGS LIMITED<br />
<strong>Annual</strong> <strong>Report</strong> <strong>2010</strong><br />
21
Performance Review and Plan<br />
Real Estate<br />
Yebisu Garden Place Co., Ltd.<br />
In Japan’s real estate sector, although the decline in<br />
occupancy rates in the Tokyo-area <strong>of</strong>fice building<br />
rent market appeared to level <strong>of</strong>f in the second half<br />
<strong>of</strong> the year, rent levels in general continued to decline<br />
throughout the year. In our Real Estate business, we<br />
sought to maintain occupancy rates and rent levels at<br />
existing properties, and pursued additional cost reduction<br />
measures. As a result, net sales increased ¥0.3 billion, or<br />
1.2%, year on year to ¥23.5 billion, with operating income<br />
up ¥0.5 billion, or 6.4%, to ¥8.0 billion.<br />
Existing Properties<br />
At existing properties, we strove to maintain occupancy rates and<br />
rents, and to further reduce costs. These efforts, however, were<br />
unable to reverse the impact <strong>of</strong> a declining rent market for Tokyoarea<br />
<strong>of</strong>fice buildings.<br />
From left: Yebisu Garden Place, Shibuya Sakuragaoka Square<br />
New Income-Generating Property Acquisitions<br />
In April, we acquired Shibuya Sakuragaoka Square, a newly built<br />
<strong>of</strong>fice building in Tokyo’s Shibuya Ward. We succeeded in maintaining<br />
high occupancy rates for this property. Three properties<br />
acquired and opened last fiscal year also contributed to full-year<br />
earnings—Rose City Higashi Sapporo, a rental condominium<br />
building in Sapporo (Hokkaido); Ebisu Square, an <strong>of</strong>fice building in<br />
Ebisu, Tokyo; and commercial property MLB café TOKYO.<br />
Real Estate Development<br />
In June, we completed construction on Shinjuku Square, an <strong>of</strong>fice<br />
building in Tokyo’s Shinjuku Ward. We also moved ahead with the<br />
development <strong>of</strong> a new wing at the PAL Urayasu fitness facility in<br />
the city <strong>of</strong> Urayasu, Chiba Prefecture.<br />
Net Sales<br />
(¥ Million)<br />
25,000<br />
20,000<br />
15,000<br />
10,000<br />
Operating Income<br />
(¥ Million)<br />
8,000<br />
6,000<br />
4,000<br />
5,000<br />
0<br />
24,148<br />
07<br />
23,452<br />
08<br />
23,267<br />
09<br />
23,537<br />
10<br />
2,000<br />
0<br />
7,073<br />
07<br />
7,612<br />
08<br />
7,524<br />
09<br />
8,003<br />
10<br />
Management Plan 2011–2012<br />
Management Targets<br />
(¥ Billion)<br />
<strong>2010</strong> results 2011 targets 2012 targets<br />
Net Sales 23.5 23.0 24.7<br />
Operating Income 8.0 8.3 9.0<br />
We will work to maintain and reinforce our stable pr<strong>of</strong>it structure<br />
and enhance the value <strong>of</strong> the Sapporo Group’s properties. We will<br />
carefully screen new prospects and acquire only prime properties.<br />
Key Points<br />
1. Enhancing the value <strong>of</strong> our properties<br />
(1) Value enhancement <strong>of</strong> Yebisu Garden Place<br />
• We will seek to maintain rents at appropriate levels and<br />
to maintain and increase the occupancy rate through an<br />
increased focus on value and tenant satisfaction.<br />
• We will endeavor to enhance the appeal <strong>of</strong> the area and<br />
increase the number <strong>of</strong> visitors through shop and restaurant<br />
renovation.<br />
(2) Embarking on redevelopment <strong>of</strong> properties in the Ginza and<br />
Ebisu areas<br />
• We will embark on measures to boost future earnings.<br />
Specifically, we will begin necessary studies to reconstruct<br />
the Sapporo Ginza Building and the Seiwa Ebisu<br />
Building to enhance the value <strong>of</strong> our prime properties.<br />
2. Acquiring new assets<br />
• We will continue to carefully screen properties, taking into consideration<br />
Group investment priorities and return on investment.<br />
Note: All Management Plan figures are derived from a simplified segment classification method based on the management approach.<br />
22<br />
SAPPORO HOLDINGS LIMITED<br />
<strong>Annual</strong> <strong>Report</strong> <strong>2010</strong>
Corporate Governance<br />
Basic Governance Approach<br />
The Sapporo Group regards strengthening and enhancing corporate<br />
governance as one <strong>of</strong> its top management priorities. The<br />
Group is working to clarify supervisory, business execution and<br />
auditing functions throughout the Group under the holding company<br />
framework. The Group is also working to strengthen management<br />
supervisory functions to increase management<br />
transparency and achieve management goals. To this end, the<br />
Group employs the following governance system.<br />
Board <strong>of</strong> Directors<br />
The Board <strong>of</strong> Directors performs a supervisory role and makes<br />
decisions on statutory matters and important matters relating to<br />
business execution stipulated by the Board’s regulations. The<br />
Board <strong>of</strong> Directors also elects and supervises the business execution<br />
<strong>of</strong> the President and Representative Director, who serves<br />
concurrently as Group CEO, as well as the group operating <strong>of</strong>ficers,<br />
and other key personnel.<br />
About Outside Directors<br />
Three <strong>of</strong> the 10 members <strong>of</strong> the Board <strong>of</strong> Directors are outside<br />
directors. All three have submitted notification to the Tokyo Stock<br />
Exchange <strong>of</strong> their independent director status as stipulated by the<br />
exchange regulations, and are expected to objectively advise and<br />
supervise the management team from a neutral standpoint. The<br />
outside directors <strong>of</strong>fered advice and suggestions regarding the<br />
screening and selection <strong>of</strong> agenda items from their independent<br />
and objective standpoint at 13 meetings <strong>of</strong> the Board <strong>of</strong> Directors<br />
held in <strong>2010</strong>.<br />
President and Representative Director and<br />
Group CEO, Group Operating Officers<br />
The President and Representative Director, Group CEO controls<br />
business execution across the entire group based on the resolutions<br />
<strong>of</strong> the Board <strong>of</strong> Directors. The group operating <strong>of</strong>ficers,<br />
under the direct authority <strong>of</strong> the President and Representative<br />
Director, Group CEO, control business execution in the main business<br />
segments.<br />
Audits by the Corporate Auditors<br />
Sapporo Holdings Ltd. uses the corporate auditor system, in<br />
which corporate auditors, who are completely independent from<br />
the Board <strong>of</strong> Directors, audit the job performance <strong>of</strong> directors<br />
from an independent standpoint. The company has therefore<br />
established a Board <strong>of</strong> Corporate Auditors. In accordance with<br />
audit policy and allocated auditing duties decided by the Board <strong>of</strong><br />
Corporate Auditors, each corporate auditor attends important<br />
meetings such as the Board <strong>of</strong> Directors meeting and the<br />
Management Council, reads over requests for approval, audits<br />
subsidiaries, and performs other related duties. The corporate<br />
auditors also receive an explanation <strong>of</strong> the audit plan from the<br />
independent auditors and the independent auditors’ report. This<br />
system allows proper auditing <strong>of</strong> the execution <strong>of</strong> duties by directors.<br />
About Outside Auditors<br />
Sapporo Holdings has four corporate auditors, two <strong>of</strong> whom are<br />
outside auditors. Both outside auditors have submitted notification<br />
to the Tokyo Stock Exchange <strong>of</strong> their independent auditor<br />
status as stipulated by the exchange regulations, and are<br />
Corporate Functions and Internal Control Relationships<br />
<strong>Annual</strong> Meeting <strong>of</strong> Shareholders<br />
Appointment/Dismissal<br />
Appointment/Dismissal<br />
Board <strong>of</strong> Directors<br />
Directors<br />
Outside Directors<br />
Supervision<br />
Board <strong>of</strong> Corporate Auditors<br />
Corporate Auditors<br />
Outside Auditors<br />
Accounting Auditor<br />
(Independent<br />
Auditor)<br />
Audit<br />
Monitoring<br />
<strong>Report</strong><br />
Election/Supervision<br />
President and Representative<br />
Director, Group CEO<br />
Management Council<br />
Group Management Council<br />
Nominating Committee<br />
Compensation Committee<br />
Advice<br />
Legal Advisor<br />
(Law Firm)<br />
Group Companies<br />
Internal Control/<br />
Risk Management<br />
Group Risk Management<br />
Committee<br />
Group Environment Protection<br />
Committee<br />
Group CSR Promotion<br />
Committee<br />
Group Personal Information<br />
Protection Committee<br />
Group Audit Department<br />
SAPPORO HOLDINGS LIMITED<br />
<strong>Annual</strong> <strong>Report</strong> <strong>2010</strong><br />
23
expected to audit the duties executed by the directors from an<br />
objective and neutral standpoint. At the 13 meetings <strong>of</strong> the Board<br />
<strong>of</strong> Directors held in <strong>2010</strong>, the outside auditors <strong>of</strong>fered input<br />
where fitting to preserve the propriety and appropriateness <strong>of</strong><br />
decisions by the directors. Similarly, the outside auditors provided<br />
input where needed on the screening and selection <strong>of</strong> agenda<br />
items and other matters at the seven meetings <strong>of</strong> the Board <strong>of</strong><br />
Corporate Auditors held during the year.<br />
Nominating and Compensation Committees<br />
Although Sapporo Holdings uses the corporate auditor system, it<br />
has also established a Nominating Committee and a Compensation<br />
Committee with the goals <strong>of</strong> increasing transparency with respect<br />
to the nomination and remuneration <strong>of</strong> directors and preserving a<br />
sound management structure. The three outside directors and the<br />
President and Representative Director form the core membership<br />
<strong>of</strong> both committees (the full-time corporate auditors are added as<br />
members when deciding compensation for corporate auditors, and<br />
when recommending candidates for corporate auditor). The committee<br />
chair is selected by the outside directors.<br />
Compensation for Directors and Corporate Auditors<br />
Compensation for directors is decided within remuneration limits set<br />
by the <strong>Annual</strong> Meeting <strong>of</strong> Shareholders. Compensation consists <strong>of</strong> a<br />
base salary for each director, determined by the duties performed,<br />
and that may, based on predetermined criteria, be adjusted in line<br />
with job performance in the previous fiscal year. Compensation for<br />
corporate auditors is also decided within remuneration limits set by<br />
the <strong>Annual</strong> Meeting <strong>of</strong> Shareholders, and consists <strong>of</strong> a base salary<br />
for each corporate auditor calculated in accordance with standards<br />
decided by the Board <strong>of</strong> Corporate Auditors.<br />
No bonuses for directors or corporate auditors were paid in<br />
<strong>2010</strong>, nor were any retirement benefits, stock options or other<br />
non-cash remuneration.<br />
Compensations amounts in <strong>2010</strong> were as follows.<br />
Base<br />
salary<br />
Bonuses<br />
Retirement<br />
benefits<br />
Stock<br />
options<br />
Eligible<br />
directors and<br />
corporate<br />
auditors<br />
Directors (Company) 115 – – – 8<br />
(Outside) 20 – – – 3<br />
Corporate<br />
auditors (Company) 39 – – – 2<br />
(Outside) 9 – – – 2<br />
Total 184 – – – 15<br />
(Notes)<br />
1. The number <strong>of</strong> Company directors (7) as <strong>of</strong> December 31, <strong>2010</strong>, includes 1<br />
director who retired in March <strong>2010</strong> counted in figures for base salary and eligible<br />
directors and corporate auditors.<br />
2. Base salary for Company directors does not include director compensation for four<br />
individuals paid by consolidated subsidiaries, nor the portion <strong>of</strong> salary paid as key<br />
personnel to one individual serving concurrently as key personnel and director.<br />
3. Base salary for Company corporate auditors includes the portion <strong>of</strong> remuneration<br />
paid by consolidated subsidiaries.<br />
Internal Audits<br />
Under instructions from the President and Representative<br />
Director, Group CEO, Sapporo Holdings has established a Group<br />
Audit Department as an internal auditing organization independent<br />
<strong>of</strong> the executive chain <strong>of</strong> command. The Group Audit<br />
Department performs internal audits across the entire Group,<br />
including operating companies and their subsidiaries. The Group<br />
Audit Department and the corporate auditors meet regularly to<br />
exchange views on the results <strong>of</strong> the internal audits, the status <strong>of</strong><br />
internal control and other related matters. The internal audit<br />
report <strong>of</strong> the Group Audit Department is read by the corporate<br />
auditors as part <strong>of</strong> the information that they share.<br />
Upgrading the Internal Control System<br />
The Group has appointed leaders responsible for creating systems<br />
to ensure appropriate financial reporting, CSR/Compliance,<br />
Group Governance and Risk Management, and is taking concrete<br />
steps to put these systems in place. The goal is to achieve full<br />
adherence to the basic policies decided by the Board <strong>of</strong> Directors,<br />
and to constantly upgrade and enhance the systems for the entire<br />
group. The secretariats <strong>of</strong> these initiatives all sit on an Internal<br />
Control Liaison Committee that the Group has also established to<br />
facilitate mutual understanding and coordination regarding the<br />
status <strong>of</strong> each project.<br />
Risk Management<br />
The Group manages risks relating to Sapporo Holdings and its<br />
subsidiaries and prepares crisis management measures. To<br />
achieve a more robust risk management structure for the entire<br />
Group the Company has formulated basic policies and management<br />
systems for Group risk management, as well as crisis management<br />
regulations. Specifically, Sapporo Holdings and its<br />
subsidiaries upgrade and develop systems for managing risks<br />
associated with important decisions made during business execution<br />
or risks inherent to it, and systems for managing crisis situations<br />
that may arise. These efforts are governed by the basic<br />
policies for the development <strong>of</strong> internal control systems.<br />
24<br />
SAPPORO HOLDINGS LIMITED<br />
<strong>Annual</strong> <strong>Report</strong> <strong>2010</strong>
Compliance<br />
The Group has set out the Sapporo Group Code <strong>of</strong> Business<br />
Conduct to provide a solid set <strong>of</strong> ethical guidelines for the conduct<br />
<strong>of</strong> all executives and employees. The Group CSR Promotion<br />
Committee has created a Group-wide compliance system and<br />
established a Whistle-Blower’s Hotline and Helpline to help with<br />
prevention and early detection <strong>of</strong> misconduct. In addition, the<br />
Group Audit Department, which is an internal auditing body that is<br />
independent <strong>of</strong> the executive chain <strong>of</strong> command, audits the general<br />
business operations <strong>of</strong> Sapporo Holdings and its subsidiaries<br />
to ensure compliance with laws and regulations, the Company’s<br />
Articles <strong>of</strong> Incorporation and internal rules.<br />
Policy Toward the Large-Scale Purchase <strong>of</strong> Share<br />
Certificates, etc., <strong>of</strong> the Company<br />
The Board <strong>of</strong> Directors considers that decisions regarding the<br />
sale <strong>of</strong> the Company’s shares in response to the attempt by a<br />
Company shareholder to pursue a large-scale purchase <strong>of</strong> shares<br />
should ultimately rest with the shareholders themselves.<br />
However, should an attempt at the large-scale purchase <strong>of</strong> shares<br />
suddenly materialize, the Board <strong>of</strong> Directors recognizes the provision<br />
<strong>of</strong> ample and appropriate information from both the intended<br />
buyer and the Company’s Board <strong>of</strong> Directors as essential to<br />
making an optimal decision. The Board <strong>of</strong> Directors has therefore<br />
formulated a policy governing large-scale share purchases* that<br />
was approved by the ordinary general meeting <strong>of</strong> shareholders.<br />
The policy stipulates that the intended purchaser provide ample<br />
and necessary information to the Company’s Board <strong>of</strong> Directors<br />
prior to initiating any attempt at a large-scale share purchase. The<br />
Board <strong>of</strong> Directors then reserves a specified period <strong>of</strong> time to<br />
review the proposed purchase, allowing it to provide shareholders<br />
with opinions and information that contribute to their final decision.<br />
In the event that the proposed purchase is unequivocally deemed<br />
to drastically harm the mutual interests <strong>of</strong> the Company’s shareholders,<br />
the Board <strong>of</strong> Directors will, as stipulated by the policy,<br />
enact measures deemed appropriate to protect such interests.<br />
To prevent an arbitrary decision to apply this policy by the<br />
Board <strong>of</strong> Directors, an independent committee staffed by three or<br />
more individuals selected from among outside directors, auditors<br />
and experts has been established to provide an institutional check.<br />
The independent committee will receive advice regarding the purchase<br />
from the Board <strong>of</strong> Directors, and <strong>of</strong>fer various counsel pertaining<br />
to the matter.<br />
*Policy Toward the Large-Scale Purchase <strong>of</strong> Share Certificates, etc. <strong>of</strong> the Company<br />
http://www.sapporoholdings.jp/english/ir/report/nr/pdf/110210_06.pdf<br />
Interview with Outside Director,<br />
Hiroshi Tanaka<br />
I was appointed as an outside director <strong>of</strong> Sapporo Holdings Ltd. in March 2008.<br />
Since then, the Company has maintained its current system <strong>of</strong> having three outside<br />
directors. The current group <strong>of</strong> outside directors each have CEO experience in a<br />
financial institution, a manufacturing company, and a general trading company,<br />
respectively. At the Board <strong>of</strong> Directors meetings my fellow outside directors and I all<br />
draw on our experience and knowledge to comment actively and objectively on the<br />
matters under consideration. I believe our role is especially effective for strengthening<br />
compliance as we can see issues from the outside that may not be noticeable<br />
from within the company and give opinions on them. I am certain that Sapporo<br />
Holdings is taking positive steps to raise its enterprise value while pursuing a balance<br />
<strong>of</strong> efficiency and transparency, and that the outside directors are functioning<br />
effectively to this end.<br />
Hiroshi Tanaka<br />
Outside Director<br />
SAPPORO HOLDINGS LIMITED<br />
<strong>Annual</strong> <strong>Report</strong> <strong>2010</strong><br />
25
Board <strong>of</strong> Directors and Auditors (As <strong>of</strong> March, 2011)<br />
Board <strong>of</strong> Directors<br />
1 2 3 4 5<br />
1 Takao Murakami (August 14, 1945)<br />
Chairman and Representative Director<br />
April 1969<br />
September 1996<br />
September 1998<br />
March 1999<br />
March 2001<br />
March 2003<br />
July 2003<br />
March 2004<br />
March 2005<br />
March 2011<br />
Joined the Company<br />
Director <strong>of</strong> Osaka Brewery<br />
Director <strong>of</strong> Production & Technology Department,<br />
Production & Technology Division<br />
Operating Officer, Director <strong>of</strong> Production &<br />
Technology Department, Production &<br />
Technology Division<br />
Senior Officer, Director <strong>of</strong> Merchandising<br />
Department, Marketing Division<br />
Senior Officer, Deputy Director <strong>of</strong> Beer<br />
Marketing & Production Division<br />
Director and Executive Managing Officer <strong>of</strong><br />
Sapporo Breweries Ltd., Director <strong>of</strong> Production<br />
& Technology Division<br />
Member <strong>of</strong> the Board<br />
Managing Director <strong>of</strong> the Company<br />
President and CEO <strong>of</strong> the Group<br />
Chairman and Representative Director (up to<br />
the present)<br />
2 Tsutomu Kamijo (January 6, 1954)<br />
President, Representative Director<br />
Group CEO<br />
April 1976<br />
November 1992<br />
September 1996<br />
November 1997<br />
March 2001<br />
September 2003<br />
September 2005<br />
March 2007<br />
March 2009<br />
March 2011<br />
Joined the Company<br />
General Manager <strong>of</strong> Corporate Planning<br />
Department<br />
General Manager <strong>of</strong> Sales Planning Department<br />
<strong>of</strong> Sapporo Beverages Co., Ltd.<br />
Director <strong>of</strong> Sales Planning Department <strong>of</strong><br />
Sapporo Beverage Co., Ltd.<br />
Member <strong>of</strong> the Board <strong>of</strong> Sapporo Beverage<br />
Co., Ltd.<br />
Director <strong>of</strong> Sales Planning Department<br />
Director and Managing Executive Officer,<br />
Director <strong>of</strong> Marketing Department <strong>of</strong> Sapporo<br />
Beverage Co., Ltd.<br />
Director and Managing Executive Officer,<br />
Director <strong>of</strong> Management Strategy Headquarters<br />
<strong>of</strong> Sapporo Beverage Co., Ltd.<br />
Member <strong>of</strong> the Board <strong>of</strong> the Company<br />
Director <strong>of</strong> Corporate Planning Department<br />
Member <strong>of</strong> the Board<br />
Managing Director <strong>of</strong> the Company<br />
President and CEO <strong>of</strong> the Group (up to the<br />
present)<br />
President and Representative Director <strong>of</strong><br />
Sapporo Beverage Co., Ltd. (up to the present)<br />
3 Yoshiyuki Mochida (January 17, 1951)<br />
Managing Director<br />
April 1973<br />
March 1991<br />
January 1996<br />
March 2001<br />
July 2003<br />
March 2004<br />
September 2004<br />
March 2005<br />
March 2007<br />
March 2009<br />
Joined the Company<br />
President <strong>of</strong> SAPPORO U.S.A., INC.<br />
General Manager <strong>of</strong> Tokyo Chuo Branch <strong>of</strong> the<br />
Company<br />
Director <strong>of</strong> International Division<br />
Director <strong>of</strong> International Division <strong>of</strong> Sapporo<br />
Breweries Ltd.<br />
Director <strong>of</strong> Corporate Planning Department <strong>of</strong><br />
the Company<br />
Director <strong>of</strong> Corporate Planning Department<br />
Member <strong>of</strong> the Board<br />
Director <strong>of</strong> Corporate Planning Department<br />
Member <strong>of</strong> the Board<br />
Managing Director<br />
President <strong>of</strong> Sapporo International Inc. (up to<br />
the present)<br />
Member <strong>of</strong> the Board<br />
Managing Director <strong>of</strong> the Company and Group<br />
Operating Officer (up to the present)<br />
4 Fumiaki Terasaka (April 12, 1949)<br />
Managing Director<br />
April 1972<br />
September 1998<br />
September 2000<br />
October 2002<br />
July 2003<br />
March 2004<br />
September 2004<br />
March 2005<br />
March 2009<br />
March <strong>2010</strong><br />
Joined the Company<br />
Director <strong>of</strong> Advertising Department, Marketing<br />
Division<br />
Director <strong>of</strong> Marketing Department, Marketing<br />
Division<br />
Director <strong>of</strong> Kyushu Sales & Marketing Division<br />
Director <strong>of</strong> Kyushu Sales & Marketing Division<br />
<strong>of</strong> Sapporo Breweries Ltd.<br />
Operating Officer and Director <strong>of</strong> Kyushu<br />
Sales & Marketing Division <strong>of</strong> Sapporo<br />
Breweries Ltd.<br />
Director and Senior Officer, Director <strong>of</strong><br />
Marketing Division <strong>of</strong> Sapporo Breweries Ltd.<br />
Director and Executive Managing Officer,<br />
Director <strong>of</strong> Marketing Division <strong>of</strong> Sapporo<br />
Breweries Ltd.<br />
Executive Managing Officer <strong>of</strong> Sapporo<br />
Breweries Ltd.<br />
President and Representative Director <strong>of</strong><br />
Sapporo Breweries Ltd. (up to the present)<br />
Member <strong>of</strong> the Board<br />
Managing Director <strong>of</strong> the Company and Group<br />
Operating Officer (up to the present)<br />
5 Hiroaki Eto (January 14, 1941)<br />
Director<br />
April 1964<br />
June 1990<br />
May 1993<br />
June 1996<br />
April 1998<br />
June 1999<br />
April 2000<br />
March 2003<br />
June 2004<br />
Joined The Fuji Bank Ltd. (currently Mizuho<br />
Bank, Ltd. and Mizuho Corporate Bank, Ltd.)<br />
Director <strong>of</strong> The Fuji bank, Ltd.<br />
Managing Director <strong>of</strong> The Fuji Bank, Ltd.<br />
Senior Managing Director <strong>of</strong> The Fuji Bank, Ltd.<br />
Deputy President <strong>of</strong> The Fuji Bank, Ltd.<br />
Deputy President <strong>of</strong> The Yasuda Trust &<br />
Banking Co., Ltd. (currently Mizuho Trust &<br />
Banking Co., Ltd.)<br />
President <strong>of</strong> The Yasuda Trust & Banking Co.,<br />
Ltd.<br />
Member <strong>of</strong> the Board<br />
Director <strong>of</strong> the Company (up to the present)<br />
Advisor <strong>of</strong> Mizuho Trust & Banking Co., Ltd.<br />
(up to the present)<br />
26<br />
SAPPORO HOLDINGS LIMITED<br />
<strong>Annual</strong> <strong>Report</strong> <strong>2010</strong>
6 7 8 9 10<br />
Board <strong>of</strong> Corporate Auditors<br />
6 Hiroshi Tanaka (September 23, 1941)<br />
Director<br />
April 1964<br />
July 1988<br />
June 1997<br />
June 1999<br />
June 2000<br />
June 2001<br />
June 2003<br />
April 2007<br />
March 2008<br />
June <strong>2010</strong><br />
Joined Kureha Chemical Industry Co., Ltd.<br />
(currently Kureha Corporation)<br />
Director <strong>of</strong> Legal & Licensing Department <strong>of</strong><br />
Kureha Corporation<br />
Director <strong>of</strong> Corporate Strategic Division <strong>of</strong> Kureha<br />
Corporation<br />
Member <strong>of</strong> the Board<br />
Senior Vice President <strong>of</strong> Kureha Corporation<br />
(in charge <strong>of</strong> marketing)<br />
Executive Vice President <strong>of</strong> Kureha Corporation<br />
(in charge <strong>of</strong> marketing)<br />
Senior Executive Vice President <strong>of</strong> Kureha<br />
Corporation (in charge <strong>of</strong> corporate strategy &<br />
marketing)<br />
President & Chief Executive Officer <strong>of</strong> Kureha<br />
Corporation<br />
Chairman <strong>of</strong> the Board <strong>of</strong> Directors <strong>of</strong> Kureha<br />
Corporation<br />
Member <strong>of</strong> the Board<br />
Director <strong>of</strong> the Company (up to the present)<br />
Advisor <strong>of</strong> Kureha Corporation (up to the<br />
present)<br />
7 Nobuo Katsumata (December 5, 1942)<br />
Director<br />
April 1966<br />
June 1996<br />
April 1999<br />
April 2001<br />
April 2003<br />
April 2008<br />
March 2009<br />
Joined Marubeni-Iida Co., Ltd. (currently<br />
Marubeni Corporation)<br />
Director <strong>of</strong> Marubeni Corporation<br />
Corporate Vice President, Director and Chief<br />
Operating Officer <strong>of</strong> Marubeni Corporation<br />
Senior Vice President, Director and Executive<br />
Corporate Officer <strong>of</strong> Marubeni Corporation<br />
President and CEO, Member <strong>of</strong> the Board <strong>of</strong><br />
Marubeni Corporation<br />
Chairman, Member <strong>of</strong> the Board <strong>of</strong> Marubeni<br />
Corporation (up to the present)<br />
Member <strong>of</strong> the Board<br />
Director <strong>of</strong> the Company (up to the present)<br />
8 Kazuo Ushio (September 8, 1950)<br />
Director<br />
April 1973<br />
September 2000<br />
Joined the Company<br />
Managing Director <strong>of</strong> Sapporo Hotel<br />
Enterprises Ltd.<br />
March 2002<br />
March 2003<br />
December 2004<br />
March 2005<br />
March 2006<br />
March 2007<br />
President <strong>of</strong> Sapporo Hotel Enterprises Ltd.<br />
President <strong>of</strong> Chateau Restaurant Co., Ltd.<br />
(concurrent)<br />
Assistant to the Director, in charge <strong>of</strong> Group<br />
Strategy <strong>of</strong> the Company<br />
Senior Officer <strong>of</strong> the Company<br />
Corporate Auditor <strong>of</strong> Sapporo Lion Limited<br />
Member <strong>of</strong> the Board<br />
Director <strong>of</strong> the Company<br />
President and Representative Director <strong>of</strong> Yebisu<br />
Garden Place Co., Ltd. (up to the present)<br />
Member <strong>of</strong> the Board<br />
Director <strong>of</strong> the Company and Group Operating<br />
Officer (up to the present)<br />
9 Hidenori Tanaka (April 16, 1955)<br />
Director<br />
April 1978<br />
July 2003<br />
March 2005<br />
March 2007<br />
March 2008<br />
April <strong>2010</strong><br />
September <strong>2010</strong><br />
Joined the Company<br />
Director <strong>of</strong> Accounting & Finance Department<br />
Director <strong>of</strong> Accounting & Finance Department<br />
<strong>of</strong> Sapporo Breweries Ltd.<br />
Member <strong>of</strong> the Board <strong>of</strong> Sapporo Breweries Ltd.<br />
Director <strong>of</strong> Accounting & Finance Department<br />
Member <strong>of</strong> the Board<br />
Director <strong>of</strong> the Company<br />
Member <strong>of</strong> the Board<br />
Director <strong>of</strong> Accounting & Finance Department<br />
<strong>of</strong> the Company<br />
Member <strong>of</strong> the Board<br />
Director <strong>of</strong> the Company (up to the present)<br />
10 Yoichi Kato (July 21, 1954)<br />
Director<br />
April 1978<br />
September 2003<br />
November 2003<br />
March 2007<br />
March 2009<br />
March 2011<br />
Joined the Company<br />
Member <strong>of</strong> the Board, Senior Officer, Director<br />
<strong>of</strong> Sales Administration Division <strong>of</strong> Yebisu<br />
Garden Place Co., Ltd.<br />
Senior Officer, Director <strong>of</strong> Corporate Planning<br />
Department <strong>of</strong> Yebisu Garden Place Co., Ltd.<br />
Director and Executive Managing Officer <strong>of</strong><br />
Yebisu Garden Place Co., Ltd.<br />
Member <strong>of</strong> the Board<br />
Director <strong>of</strong> Corporate Planning Department <strong>of</strong><br />
the Company<br />
Member <strong>of</strong> the Board<br />
Director <strong>of</strong> the Company (up to the present)<br />
Ryoichi Yamada (January 28, 1953)<br />
Standing Corporate Auditor<br />
April 1975<br />
March 2002<br />
July 2003<br />
September 2004<br />
October 2007<br />
March <strong>2010</strong><br />
March 2011<br />
Joined the Company<br />
Director <strong>of</strong> Alcoholic Beverages Department<br />
Director <strong>of</strong> Corporate Planning Department <strong>of</strong><br />
Sapporo Breweries Ltd.<br />
Director <strong>of</strong> Business Support Department <strong>of</strong><br />
the Company<br />
Director <strong>of</strong> Group Audit Department<br />
President and Representative Director <strong>of</strong><br />
Sapporo Foods Net Co., Ltd.<br />
Standing Corporate Auditor <strong>of</strong> the Company<br />
(up to the present)<br />
Isao Takehara (June 28, 1947)<br />
Corporate Auditor<br />
March 1971<br />
July 1997<br />
March 2002<br />
March 2005<br />
June 2005<br />
March 2007<br />
Joined Nippon Life Insurance Company<br />
Director <strong>of</strong> Nippon Life Insurance Company<br />
Managing Director <strong>of</strong> Nippon Life Insurance<br />
Company<br />
Director <strong>of</strong> Nippon Life Insurance Company<br />
President <strong>of</strong> NLI Research Institute (up to the<br />
present)<br />
Corporate Auditor <strong>of</strong> the Company (up to the<br />
present)<br />
Norio Henmi (June 13, 1957)<br />
Corporate Auditor<br />
April 1989<br />
June 1993<br />
March 2004<br />
Registration as lawyer (Daiichi Tokyo Bar<br />
Association)<br />
Partner <strong>of</strong> Seiwa Kyodo Law Office (currently<br />
Seiwa Meitetsu Law Office) (up to the present)<br />
Corporate Auditor <strong>of</strong> the Company (up to the<br />
present)<br />
Keizo Ae (December 22, 1950)<br />
Corporate Auditor<br />
April 1973<br />
March 2005<br />
March 2008<br />
Joined the Company<br />
Director <strong>of</strong> Accounting & Finance Department<br />
Corporate Auditor <strong>of</strong> the Company (up to the<br />
present)<br />
Notes:<br />
1. Mr. Hiroaki Eto, Mr. Hiroshi Tanaka and Mr. Nobuo Katsumata are outside directors.<br />
2. Mr. Isao Takehara and Mr. Norio Henmi are outside corporate auditors.<br />
SAPPORO HOLDINGS LIMITED<br />
<strong>Annual</strong> <strong>Report</strong> <strong>2010</strong><br />
27
Five-Year Summary (Years ended December 31)<br />
Millions <strong>of</strong> yen<br />
<strong>2010</strong> 2009 2008 2007 2006<br />
Net sales ¥389,245 ¥387,534 ¥414,558 ¥449,011 ¥435,090<br />
Alcoholic Beverages 304,218 305,496 324,720 343,670 326,420<br />
S<strong>of</strong>t Drinks 34,439 30,746 36,849 52,239 58,731<br />
Restaurants 27,051 28,026 29,538 28,954 26,995<br />
Real Estate 23,537 23,267 23,452 24,148 22,828<br />
Other – – – – 116<br />
Operating cost and expenses 373,842 374,638 399,873 436,649 426,477<br />
Operating income 15,403 12,896 14,685 12,363 8,613<br />
Income before income taxes and minority interests 17,762 8,874 17,970 221 3,978<br />
Net income 10,773 4,535 7,640 5,509 2,338<br />
Yen<br />
Per share:<br />
Net income:<br />
Primary ¥ 27.50 ¥ 11.57 ¥ 19.49 ¥ 14.10 ¥ 6.38<br />
Diluted 26.44 11.05 18.89 13.76 5.88<br />
Net assets 319.32 302.16 297.60 319.07 300.13<br />
Cash dividends 7.00 7.00 7.00 5.00 5.00<br />
Millions <strong>of</strong> yen<br />
Year-end data:<br />
Net assets ¥126,645 ¥118,591 ¥116,862 ¥125,189 ¥113,496<br />
Total assets 494,798 506,875 527,287 561,859 589,597<br />
Financial liabilities 181,335 196,794 189,252 212,464 236,033<br />
ROE (%) 8.9 3.9 6.3 4.6 2.1<br />
Capital expenditures 22,571 23,485 29,378 19,548 30,790<br />
Depreciation and amortization 22,504 22,547 21,605 24,527 21,930<br />
28<br />
SAPPORO HOLDINGS LIMITED<br />
<strong>Annual</strong> <strong>Report</strong> <strong>2010</strong>
Management’s Discussion and Analysis<br />
Sapporo Holdings Limited and the Sapporo Group<br />
The Group endeavored to initiate growth strategies and strengthen its<br />
existing businesses in accord with the key priorities <strong>of</strong> its rolling<br />
two-year plan, Sapporo Group Medium-term Management Plan <strong>2010</strong>–<br />
2011. This plan is based on the Sapporo Group’s New Management<br />
Framework unveiled in 2007.<br />
Our growth strategy involved various initiatives aimed at laying<br />
the groundwork for the future, including the following: We began constructing<br />
a brewery in Vietnam as part <strong>of</strong> our bid to enter the<br />
Vietnamese beer market; we entered into a business and capital<br />
alliance with Kyodo Milk Industry Co., Ltd.; and we entered into a beer<br />
industry business alliance with the South Korean Maeil Dairies Co.,<br />
Ltd. Meanwhile, to strengthen existing businesses, we pursued strategies<br />
that concentrated resources on certain brands and other areas<br />
<strong>of</strong> strength for our businesses.<br />
In terms <strong>of</strong> the scope <strong>of</strong> consolidation, the Company had 33<br />
consolidated subsidiaries and 6 equity-method affiliates in the year<br />
ended December 31, <strong>2010</strong>.<br />
Operational Overview<br />
In <strong>2010</strong>, the Japanese economy experienced a mild recovery from the<br />
outset <strong>of</strong> the year. But uncertainty over economic downturn amid a<br />
subsequent easing <strong>of</strong> the pace <strong>of</strong> global economic recovery and<br />
exports declining due to the yen appreciating resulted in ongoing<br />
weakness in consumer spending and downward pressure on prices.<br />
The industries in which the Sapporo Group operates were variously<br />
affected. The s<strong>of</strong>t drinks industry saw demand increase in<br />
response to record summer heat. In contrast, affected heavily by<br />
listless consumer spending, demand rose less than expected in the<br />
alcoholic beverage and restaurant industries. In the real estate industry,<br />
Greater Tokyo <strong>of</strong>fice vacancy rates appeared to bottom out during<br />
the latter half <strong>of</strong> the year, but <strong>of</strong>fice rent levels were in continual<br />
decline throughout the year.<br />
Consolidated Operating Results<br />
Net Sales<br />
Net sales increased ¥1,710 million, or 0.4%, year on year, to<br />
¥389,245 million.<br />
By business segment, Alcoholic Beverages saw a 0.4% year-onyear<br />
decline in net sales to ¥304,218 million. The Alcoholic<br />
Beverages (Japan) business saw an increase in unit sales <strong>of</strong> beer-type<br />
beverages. Yet, monetarily, net sales decreased as a consequence <strong>of</strong><br />
business growth in low-priced products. The Alcoholic Beverages<br />
(International) business, on the other hand, saw net sales increase as<br />
a result <strong>of</strong> continued strong sales performance in North America.<br />
The S<strong>of</strong>t Drinks segment saw a 12.0% year-on-year increase in<br />
net sales to ¥34,439 million, on solid sales performance spurred<br />
by an unusually hot summer, with sales remaining strong<br />
afterwards.<br />
The Restaurants segment recorded a 3.5% year-on-year decrease<br />
in net sales to ¥27,051 million. This was due to closing unpr<strong>of</strong>itable<br />
restaurants as part <strong>of</strong> earnings structure improvements.<br />
The Real Estate segment recorded a 1.2% year-on-year increase<br />
in net sales to ¥23,537 million. This reflected sales stabilizing and<br />
increasing as a result <strong>of</strong> efforts to maintain occupancy rates and rent<br />
levels on existing properties.<br />
Cost <strong>of</strong> Sales<br />
Cost <strong>of</strong> sales decreased ¥6,479 million, or 2.4%, year on year to<br />
¥261,212 million. The cost <strong>of</strong> sales ratio decreased 2.0 percentage<br />
points to 67.1%.<br />
This was mainly because sales increased while raw ingredient<br />
and materials costs and fixed manufacturing costs decreased.<br />
Selling, General and Administrative Expenses<br />
Selling, general and administrative (SG&A) expenses increased<br />
¥5,682 million, or 5.3%, year on year to ¥112,630 million.<br />
The main reasons were an increase in depreciation charges due<br />
to the launch <strong>of</strong> a new sales and logistics system in the Alcoholic<br />
Beverages (Japan) business and a combined increase in sales incentives<br />
and commissions accompanying sales increases in the S<strong>of</strong>t<br />
Drinks business.<br />
Operating Income<br />
Operating income increased ¥2,507 million, or 19.4%, year on year to<br />
¥15,403 million.<br />
The Alcoholic Beverages (Japan) business achieved operating<br />
income growth on the back <strong>of</strong> higher beer unit sales and production<br />
cost reductions. The Alcoholic Beverages (International) business<br />
achieved operating income growth thanks to increased unit sales in<br />
existing businesses, but upfront investment associated with its entry<br />
into Vietnam resulted in an overall pr<strong>of</strong>it decline.<br />
The S<strong>of</strong>t Drinks business posted sales growth and also achieved<br />
operating income growth as it continued to strengthen pr<strong>of</strong>itability.<br />
This enabled the business to fully absorb its upfront investment in<br />
food operations.<br />
Sales for the Restaurants business decreased from a slump in<br />
demand, as well as the closure <strong>of</strong> unpr<strong>of</strong>itable restaurants.<br />
Nevertheless, the business saw operating income grow from measures<br />
to rein in costs, such as negotiations to reduce rents and the<br />
closure <strong>of</strong> unpr<strong>of</strong>itable restaurants.<br />
The Real Estate business endeavored to cut costs, and to maintain<br />
occupancy rates and rent levels, and thus achieved operating<br />
income growth.<br />
Other Income (Expenses)<br />
Other income was ¥2,359 million, compared with other expenses <strong>of</strong><br />
¥4,022 million in the previous year.<br />
With regard to net financial income (expenses), calculated as the<br />
sum <strong>of</strong> interest and dividend income minus interest expense, the<br />
Company recorded expenses <strong>of</strong> ¥2,589 million in fiscal <strong>2010</strong>. This<br />
was a slight improvement on the previous year and in line with a<br />
decrease in financial liabilities.<br />
In equity in income <strong>of</strong> affiliates the Company recorded a 121.4%<br />
year-on-year increase to ¥611 million, with affiliates POKKA<br />
CORPORATION and Azumino Food Co., Ltd. contributing to this change.<br />
SAPPORO HOLDINGS LIMITED<br />
<strong>Annual</strong> <strong>Report</strong> <strong>2010</strong><br />
29
The Company also recorded a gain on the sales <strong>of</strong> property, plant<br />
and equipment <strong>of</strong> ¥16,576 million, mainly due to selling the former<br />
Osaka Plant site to generate part <strong>of</strong> the cash flow for strategic investments<br />
going forward.<br />
The Company recorded loss on disposal <strong>of</strong> property, plant and<br />
equipment <strong>of</strong> ¥1,724 million, mainly due to concentrating production<br />
facilities to further improve manufacturing efficiency.<br />
Loss on the sales <strong>of</strong> property, plant and equipment was ¥8,410<br />
million. This was due to the Company selling its Keiyo Physical<br />
Distribution Center as part <strong>of</strong> a company-wide effort to restructure<br />
and optimize the distribution network and improve the efficiency and<br />
liquidity <strong>of</strong> assets.<br />
The Company booked a loss on impairment <strong>of</strong> property, plant and<br />
equipment <strong>of</strong> ¥2,375 million. The main reason for this was the<br />
Company amortized goodwill and other intangibles recorded at<br />
SLEEMAN BREWERIES LTD., and approved a resolution to close<br />
unpr<strong>of</strong>itable locations in the Restaurants business, following revisions<br />
in the business plan.<br />
Income Before Income Taxes and Minority Interests<br />
As a result <strong>of</strong> the above and other factors, income before income taxes<br />
and minority interests increased ¥8,888 million to ¥17,762 million.<br />
Income Taxes and Net Income<br />
Income taxes applicable to the Company, calculated as the sum <strong>of</strong><br />
corporation, inhabitants’ and enterprise taxes, were ¥6,994 million.<br />
Income taxes accounted for 39.4% <strong>of</strong> income before income<br />
taxes and minority interests. The difference between this percentage<br />
and the statutory effective tax rate <strong>of</strong> 40.7% mainly reflected the<br />
recording <strong>of</strong> a valuation allowance.<br />
As a result, net income was ¥10,773 million, up 137.5% year on year.<br />
Segment Information<br />
Operating<br />
Revenues<br />
Millions <strong>of</strong> yen<br />
Operating<br />
Income<br />
Depreciation<br />
and<br />
Amortization<br />
Expenses<br />
Capital<br />
Expenditures<br />
Alcoholic Beverages ¥304,218 ¥9,804 ¥15,446 ¥ 9,159<br />
(Japan) 278,832 9,303<br />
(International) 25,386 502<br />
S<strong>of</strong>t Drinks 34,439 526 677 1,368<br />
Restaurants 27,051 109 681 319<br />
Real Estate 23,537 8,003 5,693 11,719<br />
Assets, Liabilities and Shareholders’ Equity<br />
The Sapporo Group has a cash management system (CMS), which<br />
enables Sapporo Holdings to centrally manage fund allocation within<br />
the Group in Japan.<br />
The concentration at the Company <strong>of</strong> cash flows generated by<br />
individual Group companies helps preserve fund liquidity, while flexible<br />
and efficient fund allocation within the Group serves to minimize<br />
financial liabilities.<br />
The Company strives to secure fund procurement channels and<br />
liquidity to make certain that ample funds are on hand to cover present<br />
and future operating activities, as well as the repayment <strong>of</strong> debts<br />
and other funding needs. Necessary funds are procured mainly from<br />
cash flows from operating activities, loans primarily from financial<br />
institutions, and the issuance <strong>of</strong> corporate bonds.<br />
Assets<br />
Total assets at December 31, <strong>2010</strong> stood at ¥494,798 million, down<br />
¥12,076 million, or 2.4%, from a year ago.<br />
This was mainly the result <strong>of</strong> a ¥7,459 million increase in total<br />
current assets accompanying an increase in cash and cash equivalents.<br />
However, this increase was partially <strong>of</strong>fset by a ¥19,536 million<br />
net decrease in the balance <strong>of</strong> property, plant and equipment, after<br />
sales <strong>of</strong> existing property and other assets outweighed new<br />
acquisitions <strong>of</strong> real estate.<br />
Liabilities<br />
Financial liabilities decreased ¥15,459 million to ¥181,335 million.<br />
Due to a decrease in debt, as well as a decrease in deposits<br />
accompanying the termination <strong>of</strong> gift voucher certificates for beer, total<br />
liabilities decreased ¥20,131 million, or 5.2%, to ¥368,153 million.<br />
Net Assets<br />
Retained earnings increased ¥8,030 million to ¥28,317 million at the<br />
fiscal year-end.<br />
This was because net income effectively increased retained<br />
earnings by a greater amount than dividend payments decreased it.<br />
The balance <strong>of</strong> foreign currency translation adjustments at fiscal<br />
year-end decreased ¥1,631 million, to a deficit <strong>of</strong> ¥5,259 million.<br />
This mainly reflected stronger exchange rates for the yen at foreign<br />
subsidiaries on December 31, <strong>2010</strong>, compared with the previous<br />
fiscal year-end.<br />
As a result, net assets increased ¥8,055 million from a year<br />
earlier to ¥126,645 million.<br />
Cash Flows<br />
Consolidated cash and cash equivalents as <strong>of</strong> December 31, <strong>2010</strong> were<br />
¥13,270 million, an increase <strong>of</strong> ¥7,002 million, or 111.7%, from the<br />
previous fiscal year-end. Factors behind this decrease were as follows.<br />
Cash Flows From Operating Activities<br />
Net cash provided by operating activities was ¥27,431 million,<br />
¥14,977 million, or 120.3%, higher than in the previous fiscal year.<br />
The main contributors were income before income taxes and<br />
minority interests <strong>of</strong> ¥17,762 million and depreciation and amortization<br />
<strong>of</strong> ¥22,504 million. These were partially <strong>of</strong>fset by a ¥7,866<br />
million decrease in deposits received following the termination <strong>of</strong> gift<br />
voucher certificates for beer, and other factors.<br />
Cash Flows From Investing Activities<br />
Investing activities used net cash <strong>of</strong> ¥2,595 million, a decrease <strong>of</strong><br />
¥29,632 million from the net cash used in the previous fiscal year.<br />
This change mainly reflected proceeds from the sale <strong>of</strong> Sapporo<br />
Breweries’ former Osaka Plant site and the Keiyo Physical Distribution<br />
Center, on one hand, and payments including the new acquisition <strong>of</strong><br />
real estate, on the other.<br />
Cash Flows From Financing Activities<br />
Financing activities used net cash <strong>of</strong> ¥18,120 million, a change <strong>of</strong><br />
¥21,865 million from the net cash provided by in the previous<br />
fiscal year.<br />
This was primarily the result <strong>of</strong> some proceeds from operating<br />
activities being used to reduce financial liabilities.<br />
Management Indicators<br />
The current ratio rose 5.3 <strong>of</strong> a percentage point from 60.4% to 65.7%.<br />
This was the combined result <strong>of</strong> a ¥7,459 million increase in<br />
total current assets, which reflected increases in cash and cash<br />
equivalents, and a ¥2,209 million decrease in current liabilities,<br />
which reflected a decrease in deposits received.<br />
The equity ratio rose from 23.4% a year earlier to 25.3%, reflecting<br />
higher equity capital due to an increases in retained earnings, as<br />
well as a decrease in total assets.<br />
30<br />
SAPPORO HOLDINGS LIMITED<br />
<strong>Annual</strong> <strong>Report</strong> <strong>2010</strong>
Return on equity (ROE) increased from 3.9% to 8.9%, due to the<br />
137.5% year-on-year increase in net income.<br />
The debt-to-equity (D/E) ratio, calculated as financial liabilities<br />
divided by net assets, decreased from 1.7 to 1.4 in line with the<br />
decrease in financial liabilities.<br />
Outlook For 2011<br />
The Company is forecasting consolidated net sales <strong>of</strong> ¥482,000<br />
million, an increase <strong>of</strong> ¥92,755 million, or 23.8%, year on year.<br />
Operating income is projected to increase ¥2,597 million, or<br />
16.9%, year on year to ¥18,000 million.<br />
In the Alcoholic Beverages business, we hope to secure stable<br />
operating income in the domestic market as a result <strong>of</strong> increased net<br />
sales as well as ongoing cost control. Overseas, we will incur upfront<br />
investment costs as we continue to put our Vietnam brewery into<br />
operation, which we expect to result in lower operating income year<br />
over year, despite earnings growth from existing overseas business<br />
on the back <strong>of</strong> expanding unit sales.<br />
In the S<strong>of</strong>t Drinks and Restaurants segments, we expect to<br />
increase operating income by continuing to implement measures to<br />
strengthen pr<strong>of</strong>itability.<br />
In the Real Estate segment, we project operating income growth<br />
on the back <strong>of</strong> full-year contributions from properties acquired last<br />
year as well as cost reductions.<br />
Other businesses: We expect our food operations to post operating<br />
income growth due to net sales expansion.<br />
However, net income is forecast to decrease ¥4,773 million, or<br />
44.3%, year on year to ¥6,000 million.<br />
The main factor behind the variance is the non-recurrence <strong>of</strong> a<br />
gain on the sale <strong>of</strong> property, plant and equipment booked in <strong>2010</strong>.<br />
Risk Factors<br />
Major risks that could potentially impact the operating results and<br />
financial position <strong>of</strong> the Sapporo Group, including stock price, are<br />
found below. Forward-looking statements in the following text reflect<br />
the judgment <strong>of</strong> management as <strong>of</strong> December 31, <strong>2010</strong>.<br />
High Dependency on Specific Business Areas<br />
In <strong>2010</strong>, Alcoholic Beverages, one <strong>of</strong> the Sapporo Group’s core business<br />
segments, accounted for 78.8% <strong>of</strong> consolidated net sales.<br />
The Group could thus be significantly affected by the performance<br />
<strong>of</strong> this business.<br />
Overseas Business Activities<br />
The Sapporo Group is aiming to grow earnings by expanding business<br />
activities in overseas markets. In particular, it is expanding the alcoholic<br />
beverages business in the U.S. and Canada.<br />
In Asia, which is regarded as a strategic business development<br />
region, the Sapporo Group has begun construction <strong>of</strong> a brewery in Vietnam<br />
and plans to carry out full-scale business development in the country.<br />
The overseas business activities <strong>of</strong> the Sapporo Group are subject<br />
to a variety <strong>of</strong> factors that could adversely affect operating results.<br />
These factors include economic trends, changes in the competitive<br />
landscape, and exchange rate fluctuations, in addition to changes<br />
to regulations governing investment, trade, taxation, foreign exchange<br />
and other areas, differences in business customs and labor relations,<br />
as well as other governmental and social factors.<br />
Food Product Safety<br />
Beyond quality issues originating solely at the Group, quality problems<br />
relating to generally available products and/or raw materials, as well<br />
as food poisoning and other incidents in the restaurants business,<br />
could adversely affect operating results.<br />
OEM Products and Purchased Products<br />
The Sapporo Group outsources the manufacturing <strong>of</strong> some products<br />
to external parties. It also handles products purchased from outside<br />
the Group. While the Sapporo Group does its best to ensure the<br />
quality <strong>of</strong> such products, quality problems beyond the control <strong>of</strong> the<br />
Group could result in the suspension <strong>of</strong> sales, product recalls and<br />
other actions that may in turn adversely affect operating results.<br />
Regarding Dilution <strong>of</strong> Net Income per Share<br />
Consolidated subsidiary Sapporo Beverage Co., Ltd. has issued a<br />
First Series <strong>of</strong> Unsecured Convertible Bonds With Stock Acquisition<br />
Rights. If the stock acquisition rights on these bonds are exercised,<br />
net income per share may be diluted.<br />
* As recorded with regard to these convertible bonds with stock acquisition rights under Note<br />
19. Subsequent Events, the Company plans to buy back all shares following the conversion to<br />
stock <strong>of</strong> convertible bonds with stock acquisition rights.<br />
Capital Investment Plans<br />
The Sapporo Group conducts capital investment and systems development<br />
on an ongoing basis, but related scheduling delays, investment<br />
budget overruns and other factors may adversely affect<br />
operating results.<br />
Impact <strong>of</strong> Laws and Regulations<br />
The unanticipated application <strong>of</strong> laws and regulations to Sapporo<br />
Group businesses in the future could restrict business operations,<br />
with an adverse affect on operating results.<br />
Retirement Benefit Obligations<br />
The Sapporo Group calculates employees’ retirement benefit<br />
expenses and obligations based on actuarial assumptions, such as<br />
the discount rate, and the expected rate <strong>of</strong> return on pension assets.<br />
In the event <strong>of</strong> differences between actual performance and actuarial<br />
assumptions, or a change in these assumptions, the impact will be<br />
recorded as an actuarial difference on a cumulative basis and amortized<br />
over the average remaining period <strong>of</strong> service <strong>of</strong> employees at<br />
the time <strong>of</strong> accrual.<br />
There would consequently be an impact on future retirement<br />
benefit expenses and the amount <strong>of</strong> retirement benefit obligations<br />
booked. Separately, the net retirement obligation at transition, which<br />
arose upon a change in accounting standards for retirement benefits,<br />
is amortized over 15 years.<br />
Loss on Impairment <strong>of</strong> Property, Plant and Equipment and<br />
Leased Assets<br />
The Sapporo Group records impairment losses on property, plant and<br />
equipment and leased assets, and on intangibles at the Company and<br />
consolidated subsidiaries in Japan in line with impairment criteria based<br />
on Japanese accounting standards for the impairment <strong>of</strong> fixed assets.<br />
Overseas, consolidated subsidiaries record impairment losses,<br />
as necessary, based on local accounting standards. However, going<br />
forward, the Sapporo Group may need to book additional impairment<br />
losses if assets meet impairment criteria due to changes in market<br />
and operating conditions or other factors, or the Company may need<br />
to book losses on sales and disposal <strong>of</strong> property, plant and equipment,<br />
depending on the sales price. This could adversely affect the<br />
Sapporo Group’s operating results and financial position.<br />
Holding Company Risk<br />
Sapporo Holdings derives income from brand licensing fees and commissions<br />
for management guidance, as well as interest and dividends<br />
paid by Group operating companies.<br />
Any deterioration in the financial position <strong>of</strong> Group operating<br />
companies could result in nonpayment, which may adversely affect<br />
Sapporo Holdings’ business performance.<br />
SAPPORO HOLDINGS LIMITED<br />
<strong>Annual</strong> <strong>Report</strong> <strong>2010</strong><br />
31
Consolidated Balance Sheets (December 31, <strong>2010</strong> and 2009)<br />
Millions <strong>of</strong> yen<br />
Thousands <strong>of</strong><br />
U.S. dollars (Note 1)<br />
ASSETS <strong>2010</strong> 2009 <strong>2010</strong><br />
Current assets:<br />
Cash and cash equivalents . . . . . . . . . . . . . . . . . . . . . . . . . . . . . . . . . . . . . . . . . . . . . . . . . . . . . ¥ 13,270 ¥ 6,268 $ 162,946<br />
Time deposits . . . . . . . . . . . . . . . . . . . . . . . . . . . . . . . . . . . . . . . . . . . . . . . . . . . . . . . . . . . . . . . 120 120 1,473<br />
Notes and accounts receivable—trade . . . . . . . . . . . . . . . . . . . . . . . . . . . . . . . . . . . . . . . . . . . 61,353 60,121 753,352<br />
Marketable securities (Note 11) . . . . . . . . . . . . . . . . . . . . . . . . . . . . . . . . . . . . . . . . . . . . . . . . . 2 47 25<br />
Inventories (Note 4) . . . . . . . . . . . . . . . . . . . . . . . . . . . . . . . . . . . . . . . . . . . . . . . . . . . . . . . . . . . 22,169 22,949 272,213<br />
Refundable income taxes . . . . . . . . . . . . . . . . . . . . . . . . . . . . . . . . . . . . . . . . . . . . . . . . . . . . . . – 1,237 –<br />
Allowance for doubtful receivables . . . . . . . . . . . . . . . . . . . . . . . . . . . . . . . . . . . . . . . . . . . . . . (161) (193) (1,978)<br />
Deferred tax assets (Note 15) . . . . . . . . . . . . . . . . . . . . . . . . . . . . . . . . . . . . . . . . . . . . . . . . . . . 2,811 2,788 34,511<br />
Other current assets . . . . . . . . . . . . . . . . . . . . . . . . . . . . . . . . . . . . . . . . . . . . . . . . . . . . . . . . . . 10,173 8,942 124,920<br />
Total current assets . . . . . . . . . . . . . . . . . . . . . . . . . . . . . . . . . . . . . . . . . . . . . . . . . . . . . . . . . 109,737 102,278 1,347,461<br />
Investments and long-term loans:<br />
Investment securities (Notes 11 and 13):<br />
Unconsolidated subsidiaries and affiliates . . . . . . . . . . . . . . . . . . . . . . . . . . . . . . . . . . . . . . 10,437 10,003 128,151<br />
Other . . . . . . . . . . . . . . . . . . . . . . . . . . . . . . . . . . . . . . . . . . . . . . . . . . . . . . . . . . . . . . . . . . . . . 27,591 25,388 338,789<br />
Long-term loans receivable . . . . . . . . . . . . . . . . . . . . . . . . . . . . . . . . . . . . . . . . . . . . . . . . . . . . 10,396 11,073 127,655<br />
Allowance for doubtful receivables . . . . . . . . . . . . . . . . . . . . . . . . . . . . . . . . . . . . . . . . . . . . . . (1,595) (1,764) (19,581)<br />
Deferred tax assets (Note 15) . . . . . . . . . . . . . . . . . . . . . . . . . . . . . . . . . . . . . . . . . . . . . . . . . . . 2,649 4,825 32,532<br />
Other investments . . . . . . . . . . . . . . . . . . . . . . . . . . . . . . . . . . . . . . . . . . . . . . . . . . . . . . . . . . . . 14,494 15,340 177,968<br />
63,972 64,864 785,515<br />
Property, plant and equipment (Notes 5 and 13):<br />
Land . . . . . . . . . . . . . . . . . . . . . . . . . . . . . . . . . . . . . . . . . . . . . . . . . . . . . . . . . . . . . . . . . . . . . . . 77,584 84,384 952,646<br />
Buildings and structures. . . . . . . . . . . . . . . . . . . . . . . . . . . . . . . . . . . . . . . . . . . . . . . . . . . . . . . 357,770 361,277 4,393,045<br />
Accumulated depreciation . . . . . . . . . . . . . . . . . . . . . . . . . . . . . . . . . . . . . . . . . . . . . . . . . . . . . (185,485) (184,898) (2,277,567)<br />
Machinery and vehicles . . . . . . . . . . . . . . . . . . . . . . . . . . . . . . . . . . . . . . . . . . . . . . . . . . . . . . . 180,519 182,374 2,216,592<br />
Accumulated depreciation . . . . . . . . . . . . . . . . . . . . . . . . . . . . . . . . . . . . . . . . . . . . . . . . . . . . . (142,521) (138,387) (1,750,016)<br />
Construction in progress . . . . . . . . . . . . . . . . . . . . . . . . . . . . . . . . . . . . . . . . . . . . . . . . . . . . . . 3,564 8,487 43,760<br />
Other . . . . . . . . . . . . . . . . . . . . . . . . . . . . . . . . . . . . . . . . . . . . . . . . . . . . . . . . . . . . . . . . . . . . . . . 20,400 19,784 250,496<br />
Accumulated depreciation . . . . . . . . . . . . . . . . . . . . . . . . . . . . . . . . . . . . . . . . . . . . . . . . . . . . . (15,201) (15,182) (186,653)<br />
Property, plant and equipment, net . . . . . . . . . . . . . . . . . . . . . . . . . . . . . . . . . . . . . . . . . . . . 296,629 317,839 3,642,304<br />
Intangibles<br />
Goodwill . . . . . . . . . . . . . . . . . . . . . . . . . . . . . . . . . . . . . . . . . . . . . . . . . . . . . . . . . . . . . . . . . . . . 14,128 14,927 173,478<br />
Other . . . . . . . . . . . . . . . . . . . . . . . . . . . . . . . . . . . . . . . . . . . . . . . . . . . . . . . . . . . . . . . . . . . . . . . 10,332 6,968 126,860<br />
24,460 21,894 300,339<br />
¥ 494,798 ¥ 506,875 $ 6,075,619<br />
The accompanying Notes to Consolidated Financial Statements are an integral part <strong>of</strong> these statements.<br />
SAPPORO HOLDINGS LIMITED<br />
32 <strong>Annual</strong> <strong>Report</strong> <strong>2010</strong>
Millions <strong>of</strong> yen<br />
Thousands <strong>of</strong><br />
U.S. dollars (Note 1)<br />
LIABILITIES AND NET ASSETS <strong>2010</strong> 2009 <strong>2010</strong><br />
Current liabilities:<br />
Short-term bank loans (Note 13) . . . . . . . . . . . . . . . . . . . . . . . . . . . . . . . . . . . . . . . . . . . . . . . . ¥ 4,177 ¥ 20,593 $ 51,293<br />
Current portion <strong>of</strong> long-term debt (Note 13) . . . . . . . . . . . . . . . . . . . . . . . . . . . . . . . . . . . . . . . 43,912 26,142 539,199<br />
Notes and accounts payable—trade . . . . . . . . . . . . . . . . . . . . . . . . . . . . . . . . . . . . . . . . . . . . . 24,348 20,185 298,973<br />
Liquor taxes payable . . . . . . . . . . . . . . . . . . . . . . . . . . . . . . . . . . . . . . . . . . . . . . . . . . . . . . . . . . 34,253 35,242 420,594<br />
Income taxes payable (Note 15) . . . . . . . . . . . . . . . . . . . . . . . . . . . . . . . . . . . . . . . . . . . . . . . . . 1,819 843 22,331<br />
Accrued bonuses (Note 2 (k)). . . . . . . . . . . . . . . . . . . . . . . . . . . . . . . . . . . . . . . . . . . . . . . . . . . 2,056 1,639 25,240<br />
Deposits received . . . . . . . . . . . . . . . . . . . . . . . . . . . . . . . . . . . . . . . . . . . . . . . . . . . . . . . . . . . . 19,218 27,084 235,978<br />
Other current liabilities . . . . . . . . . . . . . . . . . . . . . . . . . . . . . . . . . . . . . . . . . . . . . . . . . . . . . . . . 37,260 37,523 457,515<br />
Total current liabilities . . . . . . . . . . . . . . . . . . . . . . . . . . . . . . . . . . . . . . . . . . . . . . . . . . . . . . 167,043 169,252 2,051,123<br />
Long-term debt (Note 13) . . . . . . . . . . . . . . . . . . . . . . . . . . . . . . . . . . . . . . . . . . . . . . . . . . . . 133,245 150,059 1,636,117<br />
Dealers’ deposits for guarantees . . . . . . . . . . . . . . . . . . . . . . . . . . . . . . . . . . . . . . . . . . . . . 31,936 32,011 392,141<br />
Employees’ retirement benefits (Note 14) . . . . . . . . . . . . . . . . . . . . . . . . . . . . . . . . . . . . . . 7,191 7,488 88,296<br />
Directors’ and corporate auditors’ severance benefits. . . . . . . . . . . . . . . . . . . . . . . . . . 42 46 519<br />
Deferred tax liabilities (Note 15) . . . . . . . . . . . . . . . . . . . . . . . . . . . . . . . . . . . . . . . . . . . . . . 13,455 12,098 165,216<br />
Other long-term liabilities . . . . . . . . . . . . . . . . . . . . . . . . . . . . . . . . . . . . . . . . . . . . . . . . . . . 15,240 17,331 187,129<br />
Contingent liabilities (Note 8)<br />
Total liabilities . . . . . . . . . . . . . . . . . . . . . . . . . . . . . . . . . . . . . . . . . . . . . . . . . . . . . . . . . . . . . 368,153 388,284 4,520,542<br />
Net assets<br />
Shareholders’ equity:<br />
Common stock (Note 18)<br />
Authorized — 1,000,000,000 shares<br />
<strong>Issue</strong>d — at December 31, <strong>2010</strong> 393,971,493 shares . . . . . . . . . . . . . . . . . . . . . . . . . . 53,887 – 661,673<br />
— at December 31, 2009 393,971,493 shares . . . . . . . . . . . . . . . . . . . . . . . . . . – 53,887 –<br />
Capital surplus . . . . . . . . . . . . . . . . . . . . . . . . . . . . . . . . . . . . . . . . . . . . . . . . . . . . . . . . . . . . . . . 46,316 46,318 568,707<br />
Retained earnings (Note 6) . . . . . . . . . . . . . . . . . . . . . . . . . . . . . . . . . . . . . . . . . . . . . . . . . . . . . 28,317 20,287 347,708<br />
Treasury stock, at cost . . . . . . . . . . . . . . . . . . . . . . . . . . . . . . . . . . . . . . . . . . . . . . . . . . . . . . . . (1,190) (1,132) (14,617)<br />
Total shareholders’ equity . . . . . . . . . . . . . . . . . . . . . . . . . . . . . . . . . . . . . . . . . . . . . . . . . . . 127,329 119,360 1,563,471<br />
Valuation and translation adjustments<br />
Unrealized holding gain on securities . . . . . . . . . . . . . . . . . . . . . . . . . . . . . . . . . . . . . . . . . . . . 2,985 2,638 36,659<br />
Deferred hedge gains . . . . . . . . . . . . . . . . . . . . . . . . . . . . . . . . . . . . . . . . . . . . . . . . . . . . . . . . . (8) 1 (98)<br />
Foreign currency translation adjustments . . . . . . . . . . . . . . . . . . . . . . . . . . . . . . . . . . . . . . . . (5,259) (3,627) (64,571)<br />
Total valuation and translation adjustments . . . . . . . . . . . . . . . . . . . . . . . . . . . . . . . . . . . . . (2,281) (989) (28,010)<br />
Minority Interests. . . . . . . . . . . . . . . . . . . . . . . . . . . . . . . . . . . . . . . . . . . . . . . . . . . . . . . . . . . 1,598 219 19,616<br />
Total net assets . . . . . . . . . . . . . . . . . . . . . . . . . . . . . . . . . . . . . . . . . . . . . . . . . . . . . . . . . . . . . . 126,645 118,591 1,555,077<br />
¥494,798 ¥506,875 $6,075,619<br />
SAPPORO HOLDINGS LIMITED<br />
<strong>Annual</strong> <strong>Report</strong> <strong>2010</strong><br />
33
Consolidated Statements <strong>of</strong> Income (Three years ended December 31)<br />
Millions <strong>of</strong> yen<br />
Thousands <strong>of</strong><br />
U.S. dollars (Note 1)<br />
<strong>2010</strong> 2009 2008 <strong>2010</strong><br />
Net sales . . . . . . . . . . . . . . . . . . . . . . . . . . . . . . . . . . . . . . . . . . . . . . . . . . . . . . ¥389,245 ¥387,534 ¥414,558 $4,779,528<br />
Operating cost and expenses:<br />
Cost <strong>of</strong> sales . . . . . . . . . . . . . . . . . . . . . . . . . . . . . . . . . . . . . . . . . . . . . . . . . . . . 261,212 267,690 288,146 3,207,415<br />
Selling, general and administrative expenses . . . . . . . . . . . . . . . . . . . . . . . . 112,630 106,948 111,726 1,382,978<br />
Operating income . . . . . . . . . . . . . . . . . . . . . . . . . . . . . . . . . . . . . . . . . . . . . . . 15,403 12,896 14,685 189,134<br />
Other income (expenses):<br />
Interest and dividend income . . . . . . . . . . . . . . . . . . . . . . . . . . . . . . . . . . . . . 1,058 936 969 12,992<br />
Interest expense . . . . . . . . . . . . . . . . . . . . . . . . . . . . . . . . . . . . . . . . . . . . . . . . (3,647) (3,623) (3,717) (44,779)<br />
Other, net (Notes 5 and 7) . . . . . . . . . . . . . . . . . . . . . . . . . . . . . . . . . . . . . . . . . 4,948 (1,334) 6,033 60,755<br />
2,359 (4,022) 3,285 28,968<br />
Income before income taxes and minority interests . . . . . . . . . . . . . . . 17,762 8,874 17,970 218,102<br />
Income taxes (Note 15):<br />
Current . . . . . . . . . . . . . . . . . . . . . . . . . . . . . . . . . . . . . . . . . . . . . . . . . . . . . . . . 3,171 913 519 38,935<br />
Deferred . . . . . . . . . . . . . . . . . . . . . . . . . . . . . . . . . . . . . . . . . . . . . . . . . . . . . . . 3,823 3,437 9,835 46,938<br />
6,994 4,350 10,354 85,873<br />
Minority interests . . . . . . . . . . . . . . . . . . . . . . . . . . . . . . . . . . . . . . . . . . . . . . 4 11 25 48<br />
Net income (Note 18) . . . . . . . . . . . . . . . . . . . . . . . . . . . . . . . . . . . . . . . . . . . ¥ 10,773 ¥ 4,535 ¥ 7,640 $ 132,277<br />
The accompanying Notes to Consolidated Financial Statements are an integral part <strong>of</strong> these statements.<br />
SAPPORO HOLDINGS LIMITED<br />
34 <strong>Annual</strong> <strong>Report</strong> <strong>2010</strong>
Consolidated Statements <strong>of</strong> Shareholders’ Equity (Three years ended December 31)<br />
Millions <strong>of</strong> yen<br />
Thousands <strong>of</strong><br />
U.S. dollars (Note 1)<br />
<strong>2010</strong> 2009 2008 <strong>2010</strong><br />
Common stock:<br />
Balance at beginning <strong>of</strong> year . . . . . . . . . . . . . . . . . . . . . . . . . . . . . . . . . . . . . . ¥53,887 ¥53,887 ¥53,887 $661,673<br />
Net change during the year . . . . . . . . . . . . . . . . . . . . . . . . . . . . . . . . . . . . . . . – – – –<br />
Balance at end <strong>of</strong> year . . . . . . . . . . . . . . . . . . . . . . . . . . . . . . . . . . . . . . . . . . . . ¥53,887 ¥53,887 ¥53,887 $661,673<br />
Capital surplus:<br />
Balance at beginning <strong>of</strong> year . . . . . . . . . . . . . . . . . . . . . . . . . . . . . . . . . . . . . . ¥46,318 ¥46,326 ¥46,310 $568,742<br />
Net change during the year . . . . . . . . . . . . . . . . . . . . . . . . . . . . . . . . . . . . . . . – – – –<br />
Disposition <strong>of</strong> treasury stock . . . . . . . . . . . . . . . . . . . . . . . . . . . . . . . . . . . . . . (3) (7) 15 (35)<br />
Balance at end <strong>of</strong> year . . . . . . . . . . . . . . . . . . . . . . . . . . . . . . . . . . . . . . . . . . . . ¥46,316 ¥46,318 ¥46,326 $568,707<br />
Retained earnings (Note 6):<br />
Balance at beginning <strong>of</strong> year . . . . . . . . . . . . . . . . . . . . . . . . . . . . . . . . . . . . . . ¥20,287 ¥19,972 ¥14,293 $249,103<br />
Net income . . . . . . . . . . . . . . . . . . . . . . . . . . . . . . . . . . . . . . . . . . . . . . . . . . . . . 10,773 4,535 7,640 132,277<br />
Cash dividends . . . . . . . . . . . . . . . . . . . . . . . . . . . . . . . . . . . . . . . . . . . . . . . . . (2,742) (2,743) (1,961) (33,672)<br />
Changes due to change in accounting policies applied to<br />
foreign subsidiaries . . . . . . . . . . . . . . . . . . . . . . . . . . . . . . . . . . . . . . . . . . . . . – (1,477) – –<br />
Balance at end <strong>of</strong> year . . . . . . . . . . . . . . . . . . . . . . . . . . . . . . . . . . . . . . . . . . . . ¥28,317 ¥20,287 ¥19,972 $347,708<br />
Treasury stock, at cost:<br />
Balance at beginning <strong>of</strong> year . . . . . . . . . . . . . . . . . . . . . . . . . . . . . . . . . . . . . . ¥(1,132) ¥(1,058) ¥ (849) $(13,895)<br />
Net increase . . . . . . . . . . . . . . . . . . . . . . . . . . . . . . . . . . . . . . . . . . . . . . . . . . . . (59) (73) (209) (722)<br />
Balance at end <strong>of</strong> year . . . . . . . . . . . . . . . . . . . . . . . . . . . . . . . . . . . . . . . . . . . . ¥(1,190) ¥(1,132) ¥(1,058) $(14,617)<br />
Unrealized holding gain on securities:<br />
Balance at beginning <strong>of</strong> year . . . . . . . . . . . . . . . . . . . . . . . . . . . . . . . . . . . . . . ¥ 2,638 ¥ 3,046 ¥ 9,641 $ 32,390<br />
Net change during the year . . . . . . . . . . . . . . . . . . . . . . . . . . . . . . . . . . . . . . . 348 (408) (6,595) 4,269<br />
Balance at end <strong>of</strong> year . . . . . . . . . . . . . . . . . . . . . . . . . . . . . . . . . . . . . . . . . . . . ¥ 2,985 ¥ 2,638 ¥ 3,046 $ 36,659<br />
Deferred hedge gains:<br />
Balance at beginning <strong>of</strong> year . . . . . . . . . . . . . . . . . . . . . . . . . . . . . . . . . . . . . . ¥ 1 – – $ 12<br />
Net change during the year . . . . . . . . . . . . . . . . . . . . . . . . . . . . . . . . . . . . . . . (9) 1 – (110)<br />
Balance at end <strong>of</strong> year . . . . . . . . . . . . . . . . . . . . . . . . . . . . . . . . . . . . . . . . . . . . ¥ (8) ¥ 1 – $ (98)<br />
Foreign currency translation adjustments (Note 2 (n)):<br />
Balance at beginning <strong>of</strong> year . . . . . . . . . . . . . . . . . . . . . . . . . . . . . . . . . . . . . . ¥(3,627) ¥(5,536) ¥ 1,853 $(44,541)<br />
Net change during the year . . . . . . . . . . . . . . . . . . . . . . . . . . . . . . . . . . . . . . . (1,631) 1,909 (7,390) (20,030)<br />
Balance at end <strong>of</strong> year . . . . . . . . . . . . . . . . . . . . . . . . . . . . . . . . . . . . . . . . . . . . ¥(5,259) ¥(3,627) ¥(5,536) $(64,571)<br />
Minority Interests:<br />
Balance at beginning <strong>of</strong> year . . . . . . . . . . . . . . . . . . . . . . . . . . . . . . . . . . . . . . ¥ 219 ¥ 226 ¥ 54 $ 2,687<br />
Net change during the year . . . . . . . . . . . . . . . . . . . . . . . . . . . . . . . . . . . . . . . 1,379 (7) 172 16,929<br />
Balance at end <strong>of</strong> year . . . . . . . . . . . . . . . . . . . . . . . . . . . . . . . . . . . . . . . . . . . . ¥ 1,598 ¥ 219 ¥ 226 $ 19,616<br />
The accompanying Notes to Consolidated Financial Statements are an integral part <strong>of</strong> these statements.<br />
SAPPORO HOLDINGS LIMITED<br />
<strong>Annual</strong> <strong>Report</strong> <strong>2010</strong><br />
35
Consolidated Statements <strong>of</strong> Cash Flows (Three years ended December 31)<br />
SAPPORO HOLDINGS LIMITED<br />
36 <strong>Annual</strong> <strong>Report</strong> <strong>2010</strong><br />
Millions <strong>of</strong> yen<br />
Thousands <strong>of</strong><br />
U.S. dollars (Note 1)<br />
<strong>2010</strong> 2009 2008 <strong>2010</strong><br />
Cash flows from operating activities:<br />
Income before income taxes and minority interests . . . . . . . . . . . . . . . . . . . . ¥17,762 ¥ 8,874 ¥ 17,970 $ 218,102<br />
Depreciation and amortization. . . . . . . . . . . . . . . . . . . . . . . . . . . . . . . . . . . . . . 22,504 22,547 21,605 276,328<br />
Loss on impairment <strong>of</strong> property, plant and equipment and leased assets . . . . . 2,375 926 8,207 29,157<br />
Goodwill amortization expense . . . . . . . . . . . . . . . . . . . . . . . . . . . . . . . . . . . . . 1,173 1,032 867 14,402<br />
Decrease in employees’ retirement benefits . . . . . . . . . . . . . . . . . . . . . . . . . . (297) (43) (7,604) (3,645)<br />
Decrease in allowance for doubtful receivables . . . . . . . . . . . . . . . . . . . . . . . . (198) (23) (523) (2,428)<br />
Interest and dividend income . . . . . . . . . . . . . . . . . . . . . . . . . . . . . . . . . . . . . . (1,058) (936) (969) (12,992)<br />
Interest expense . . . . . . . . . . . . . . . . . . . . . . . . . . . . . . . . . . . . . . . . . . . . . . . . . 3,647 3,623 3,715 44,779<br />
Gain on sales <strong>of</strong> property, plant and equipment . . . . . . . . . . . . . . . . . . . . . . . . (16,576) (948) (25,893) (203,532)<br />
Loss on sales and disposal <strong>of</strong> property, plant and equipment . . . . . . . . . . . . . 10,133 1,524 5,836 124,424<br />
Gain on sales <strong>of</strong> investment securities . . . . . . . . . . . . . . . . . . . . . . . . . . . . . . . (645) (20) (21) (7,917)<br />
Loss on devaluation <strong>of</strong> investment securities . . . . . . . . . . . . . . . . . . . . . . . . . 1,246 244 747 15,294<br />
(Increase) decrease in notes and accounts receivable . . . . . . . . . . . . . . . . . . (1,598) 2,668 5,761 (19,621)<br />
(Increase) decrease in inventories . . . . . . . . . . . . . . . . . . . . . . . . . . . . . . . . . . . 571 (981) 1,057 7,016<br />
Decrease in other current assets . . . . . . . . . . . . . . . . . . . . . . . . . . . . . . . . . . . . – 5,976 – –<br />
Increase (decrease) in notes and accounts payable. . . . . . . . . . . . . . . . . . . . . 4,276 (3,884) (1,447) 52,504<br />
Decrease in liquor taxes payable . . . . . . . . . . . . . . . . . . . . . . . . . . . . . . . . . . . . (943) (433) (2,287) (11,575)<br />
Decrease in deposits received . . . . . . . . . . . . . . . . . . . . . . . . . . . . . . . . . . . . . . (7,866) (19,751) (1,854) (96,590)<br />
Increase (decrease) in other current liabilities . . . . . . . . . . . . . . . . . . . . . . . . . 611 (4,402) 4,806 7,498<br />
Other . . . . . . . . . . . . . . . . . . . . . . . . . . . . . . . . . . . . . . . . . . . . . . . . . . . . . . . . . . . (4,127) (1,836) 254 (50,677)<br />
Subtotal . . . . . . . . . . . . . . . . . . . . . . . . . . . . . . . . . . . . . . . . . . . . . . . . . . . . . . 30,990 14,156 30,226 380,530<br />
Interest and dividends received . . . . . . . . . . . . . . . . . . . . . . . . . . . . . . . . . . . . 1,134 932 974 13,929<br />
Interest paid . . . . . . . . . . . . . . . . . . . . . . . . . . . . . . . . . . . . . . . . . . . . . . . . . . . . . (3,616) (3,545) (3,743) (44,406)<br />
Income taxes paid . . . . . . . . . . . . . . . . . . . . . . . . . . . . . . . . . . . . . . . . . . . . . . . . (2,289) (1,952) (5,165) (28,108)<br />
Income taxes refundable. . . . . . . . . . . . . . . . . . . . . . . . . . . . . . . . . . . . . . . . . . . 1,212 2,862 – 14,880<br />
Net cash provided by operating activities . . . . . . . . . . . . . . . . . . . . . . . . . . . . 27,431 12,454 22,292 336,825<br />
Cash flows from investing activities:<br />
Net increase in time deposit . . . . . . . . . . . . . . . . . . . . . . . . . . . . . . . . . . . . . . . – – 273 –<br />
Purchases <strong>of</strong> investment securities . . . . . . . . . . . . . . . . . . . . . . . . . . . . . . . . . . (2,812) (1,469) (1,167) (34,531)<br />
Proceeds from redemption and sales <strong>of</strong> investment securities . . . . . . . . . . . . . 791 57 152 9,710<br />
Purchases <strong>of</strong> affiliates securities . . . . . . . . . . . . . . . . . . . . . . . . . . . . . . . . . . . . (760) (8,043) (52) (9,337)<br />
Purchases <strong>of</strong> newly consolidated subsidiaries . . . . . . . . . . . . . . . . . . . . . . . . . (1,609) – – (19,755)<br />
Purchases <strong>of</strong> property, plant and equipment . . . . . . . . . . . . . . . . . . . . . . . . . . (17,528) (18,399) (22,791) (215,221)<br />
Proceeds from sales <strong>of</strong> property, plant and equipment . . . . . . . . . . . . . . . . . . 23,746 1,439 49,083 291,578<br />
Purchases <strong>of</strong> intangibles . . . . . . . . . . . . . . . . . . . . . . . . . . . . . . . . . . . . . . . . . . . (2,048) (3,429) (4,551) (25,146)<br />
Increase in long-term loans receivable . . . . . . . . . . . . . . . . . . . . . . . . . . . . . . . (22) (755) (525) (264)<br />
Collection <strong>of</strong> long-term loans receivable . . . . . . . . . . . . . . . . . . . . . . . . . . . . . . 665 208 252 8,169<br />
Other . . . . . . . . . . . . . . . . . . . . . . . . . . . . . . . . . . . . . . . . . . . . . . . . . . . . . . . . . . . (3,019) (1,836) (3,816) (37,066)<br />
Net cash used in (provided by) investing activities . . . . . . . . . . . . . . . . . . . (2,595) (32,227) 16,856 (31,863)<br />
Cash flows from financing activities:<br />
Net decrease in short-term bank loans . . . . . . . . . . . . . . . . . . . . . . . . . . . . . . . (16,366) (6,399) (4,816) (200,956)<br />
Proceeds from long-term debt . . . . . . . . . . . . . . . . . . . . . . . . . . . . . . . . . . . . . . 15,600 50,000 20,358 191,552<br />
Repayment <strong>of</strong> long-term debt . . . . . . . . . . . . . . . . . . . . . . . . . . . . . . . . . . . . . . (16,287) (17,254) (35,685) (199,993)<br />
Proceeds from issuance <strong>of</strong> bonds. . . . . . . . . . . . . . . . . . . . . . . . . . . . . . . . . . . . 11,952 – 3,843 146,758<br />
Redemption <strong>of</strong> bonds . . . . . . . . . . . . . . . . . . . . . . . . . . . . . . . . . . . . . . . . . . . . . (10,000) (19,710) – (122,790)<br />
Net decrease in commercial paper . . . . . . . . . . . . . . . . . . . . . . . . . . . . . . . . . . – – (4,000) –<br />
Cash dividends paid . . . . . . . . . . . . . . . . . . . . . . . . . . . . . . . . . . . . . . . . . . . . . . (2,741) (2,739) (1,964) (33,661)<br />
Purchase <strong>of</strong> treasury stock . . . . . . . . . . . . . . . . . . . . . . . . . . . . . . . . . . . . . . . . . (75) (120) (262) (921)<br />
Proceeds from sales <strong>of</strong> treasury stock . . . . . . . . . . . . . . . . . . . . . . . . . . . . . . . . 13 39 68 164<br />
Proceeds from minority shareholders . . . . . . . . . . . . . . . . . . . . . . . . . . . . . . . . – – 251 –<br />
Other . . . . . . . . . . . . . . . . . . . . . . . . . . . . . . . . . . . . . . . . . . . . . . . . . . . . . . . . . . . (215) (71) – (2,643)<br />
Net cash (used in) provided by financing activities . . . . . . . . . . . . . . . . . . . . (18,120) 3,746 (22,207) (222,489)<br />
Effect <strong>of</strong> exchange rate changes on cash and cash equivalents . . . . . . . . . . . . 286 77 (605) 3,509<br />
Net decrease (increase) in cash and cash equivalents . . . . . . . . . . . . . . . . . . 7,002 (15,950) 16,336 85,983<br />
Cash and cash equivalents at beginning <strong>of</strong> year . . . . . . . . . . . . . . . . . . . . . . . . . . 6,268 22,218 5,882 76,963<br />
Cash and cash equivalents at end <strong>of</strong> year . . . . . . . . . . . . . . . . . . . . . . . . . . . . ¥13,270 ¥ 6,268 ¥ 22,218 $ 162,946<br />
The accompanying Notes to Consolidated Financial Statements are an integral part <strong>of</strong> these statements.
Notes to Consolidated Financial Statements<br />
1. Basis <strong>of</strong> Presentation<br />
The Company and its domestic consolidated subsidiaries maintain their accounting records and prepare their financial statements in accordance<br />
with accounting principles generally accepted in Japan, which are different in certain respects as to the application and disclosure requirements<br />
<strong>of</strong> International Financial <strong>Report</strong>ing Standards, and its consolidated foreign subsidiaries, in conformity with that <strong>of</strong> their country <strong>of</strong> domicile. The<br />
accompanying financial statements have been compiled from the consolidated financial statements prepared by the Company as required by the<br />
Financial Instruments and Exchange Act <strong>of</strong> Japan.<br />
The relevant notes have been prepared as additional information. In addition, certain reclassifications have been made to present the<br />
accompanying consolidated financial statements in a format which is familiar to readers outside Japan. In addition, certain reclassifications <strong>of</strong><br />
previously reported amounts have been made to conform the consolidated financial statements for the years ended December 31, 2008 and<br />
2009 to the <strong>2010</strong> presentation.<br />
For the convenience <strong>of</strong> the reader, the accompanying consolidated financial statements as <strong>of</strong> and for the year ended December 31, <strong>2010</strong><br />
have been translated from yen amounts into U.S. dollar amounts at the rate <strong>of</strong> ¥81.44=U.S.$1.00, the exchange rate prevailing on December<br />
31, <strong>2010</strong>.<br />
2. Summary <strong>of</strong> Significant Accounting Policies<br />
(a) Principles <strong>of</strong> consolidation<br />
The accompanying consolidated financial statements include the accounts <strong>of</strong> the Company and its significant subsidiaries. All significant intercompany<br />
balances, transactions and pr<strong>of</strong>its have been eliminated in consolidation.<br />
During the year ended December 31, <strong>2010</strong>, the Company newly established 1 subsidiary, gained 2 subsidiaries via share acquisitions, lost 1<br />
subsidiary due to corporate liquidation, and lost 4 subsidiaries due to a merger among consolidated subsidiaries overseas. Accordingly, the<br />
number <strong>of</strong> consolidated subsidiaries was 33 as <strong>of</strong> December 31, <strong>2010</strong>.<br />
The Company’s remaining subsidiaries, whose gross assets, net sales, net income and retained earnings were not significant in the aggregate<br />
in relation to comparable balances in the consolidated financial statements, have not been consolidated.<br />
(b) Investments in unconsolidated subsidiaries and affiliates<br />
During the year ended December 31, <strong>2010</strong>, the Company lost 1 subsidiary due to corporate liquidation. As a result, the Company had made<br />
investments in 6 affiliates accounted for by the equity method as <strong>of</strong> December 31, <strong>2010</strong>.<br />
Investments in unconsolidated subsidiaries and affiliates other than those accounted for by the equity method are stated at cost determined<br />
by the moving-average method as, in the aggregate, they were not material.<br />
(c) Cash equivalents<br />
All highly liquid investments with a maturity <strong>of</strong> three months or less when purchased are considered cash equivalents.<br />
(d) Marketable and investment securities<br />
Securities other than those <strong>of</strong> subsidiaries and affiliates are classified into three categories: trading, held-to-maturity and other securities.<br />
Trading securities are carried at fair value and held-to-maturity securities are carried at amortized cost. Marketable securities classified as other<br />
securities are carried at fair value as <strong>of</strong> the end <strong>of</strong> the year, with any net unrealized gain or loss included as a separate component <strong>of</strong> shareholders’<br />
equity, net <strong>of</strong> the related taxes.<br />
Nonmarketable securities classified as other securities are carried at cost. Cost <strong>of</strong> securities sold is determined by the moving-average method.<br />
(e) Derivatives<br />
Derivatives positions are stated at fair value.<br />
(f) Inventories<br />
Inventories are stated at cost determined principally by the average method.<br />
(g) Property, plant and equipment<br />
Property, plant and equipment is stated at cost. Depreciation is computed by the declining-balance method over the estimated useful lives <strong>of</strong> the<br />
manufacturing facilities for alcoholic beverages and s<strong>of</strong>t drinks, and by the straight-line method for the real estate assets held and for buildings<br />
acquired in Japan subsequent to March 31, 1988. The annual provisions for depreciation have been computed over periods from 2 to 65 years<br />
for buildings and structures, and from 2 to 17 years for machinery and vehicles.<br />
For property and equipment retired or otherwise disposed <strong>of</strong>, costs and related depreciation are charged to the respective accounts and the<br />
net difference, less any amount realized on disposal, is charged to operations.<br />
SAPPORO HOLDINGS LIMITED<br />
<strong>Annual</strong> <strong>Report</strong> <strong>2010</strong><br />
37
Maintenance and repairs, including minor refurbishments and improvements, are charged to income as incurred.<br />
The Company and its consolidated subsidiaries in Japan have reviewed the useful lives <strong>of</strong> property, plant and equipment following the amendment<br />
<strong>of</strong> Japan’s Corporation Tax Act in the fiscal year ended March 31, 2008, and effective from the year ended December 31, 2009, have<br />
revised the useful lives for depreciation <strong>of</strong> machinery assets. As a result <strong>of</strong> this revision, operating income and income before income taxes and<br />
minority interests were each ¥1,569 million lower than would have been reported previously. Please see “17. Segment Information (10)” for<br />
details on the impact <strong>of</strong> this revision on each segment.<br />
(h) Intangibles<br />
Intangibles with limited useful lives are amortized by the straight-line method over their estimated useful lives.<br />
S<strong>of</strong>tware used internally is amortized by the straight-line method over its estimated useful life (5 years) within the Company.<br />
(i) Lease assets<br />
Lease assets are amortized by the straight-line method with the lease period considered to be the useful life and the guaranteed residual value<br />
considered to be the residual value.<br />
Finance leases other than those that transfer ownership <strong>of</strong> the leased assets to the lessees, entered into on or before December 31, 2008,<br />
are treated in the same way as ordinary operating leases for accounting purposes.<br />
(j) Allowance for doubtful accounts<br />
The allowance for doubtful accounts is estimated as the average percentage <strong>of</strong> actual historical bad debts, which is then applied to the balance<br />
<strong>of</strong> receivables. In addition, an amount deemed necessary to cover uncollectible receivables is provided for specific doubtful accounts.<br />
(k) Accrued bonuses<br />
The accrual for employees’ bonuses is based on an estimate <strong>of</strong> the amounts to be paid subsequent to the balance sheet date.<br />
(l) Employees’ retirement benefits<br />
Employees’ retirement benefits are provided principally at an amount calculated based on the retirement benefit obligation and the fair value <strong>of</strong><br />
the pension plan assets at the balance sheet date, as adjusted for the unrecognized net retirement benefit obligation at transition, unrecognized<br />
actuarial gain or loss, and unrecognized past service cost. The net retirement benefit obligation at transition is being amortized over a period <strong>of</strong><br />
9 years through 14 years by the straight-line method. Actuarial gain and loss are amortized in the year following the year in which the gain or loss<br />
is recognized primarily by the straight-line method over the average remaining years <strong>of</strong> service <strong>of</strong> the eligible employees (9 years through 15<br />
years). Past service cost is amortized by the straight-line method over the average remaining years <strong>of</strong> service <strong>of</strong> the employees (15 years).<br />
As <strong>of</strong> May 1, 2008, the Company and consolidated subsidiary Sapporo Breweries Ltd. converted all <strong>of</strong> their retirement benefit systems to a<br />
point-based retirement benefit plan, and introduced a defined contribution pension plan. In accordance with the switch to the latter plan, the<br />
Company and Sapporo Breweries Ltd. have applied “Accounting for the Transfer between Retirement Benefit Plans” (ASBJ Guidance No. 1,<br />
January 31, 2002). As a result <strong>of</strong> applying this accounting standard, the Company and the consolidated subsidiary recorded a ¥1,307 million<br />
loss on revision <strong>of</strong> the retirement benefit plan under extraordinary losses for the year ended December 31, 2008.<br />
Effective from the year ended December 31, 2008, the Company and consolidated subsidiary Sapporo Breweries Ltd. have also changed the<br />
average remaining years <strong>of</strong> service <strong>of</strong> eligible employees in line with a reduction in the average remaining period <strong>of</strong> service <strong>of</strong> employees.<br />
Consequently, the Company and Sapporo Breweries Ltd. have reduced the amortization periods for both past service cost and actuarial differences<br />
from 15 years to 14 years. As a result <strong>of</strong> this change, operating income, income before income taxes and minority interests were each<br />
¥13 million lower than would have been recorded previously.<br />
Effective from the year ended December 31, 2009, consolidated subsidiary SAPPORO LOGISTICS SYSTEMS CO., LTD. has changed the<br />
average remaining years <strong>of</strong> service <strong>of</strong> eligible employees in line with a reduction in the average remaining period <strong>of</strong> service <strong>of</strong> employees.<br />
Consequently, SAPPORO LOGISTICS SYSTEMS has reduced the amortization periods for both past service cost and actuarial differences from 11<br />
years to 9 years. As a result <strong>of</strong> this change, operating income and income before income taxes and minority interests were each ¥28 million<br />
lower than would have been reported previously.<br />
(m) Directors’ and corporate auditors’ severance benefits<br />
Directors and corporate auditors <strong>of</strong> the Company and certain consolidated subsidiaries are customarily entitled to lump-sum severance payments.<br />
Provisions for these <strong>of</strong>ficers’ severance benefits are made at estimated amounts.<br />
Effective the year ended December 31, 2004, the Company and one consolidated subsidiary abolished their directors’ and corporate auditors’<br />
severance benefit system. Accordingly, no additional provisions for these severance benefits have been recognized.<br />
SAPPORO HOLDINGS LIMITED<br />
38 <strong>Annual</strong> <strong>Report</strong> <strong>2010</strong>
(n) Foreign currency translation<br />
All monetary assets and liabilities denominated in foreign currencies, whether long-term or short-term, are translated into Japanese yen at the<br />
exchange rates prevailing at the balance sheet date. The resulting exchange gain or loss is credited or charged to income.<br />
All assets and liabilities <strong>of</strong> foreign subsidiaries are translated into Japanese yen at the exchange rates prevailing at the balance sheet date.<br />
Revenues and expenses <strong>of</strong> foreign subsidiaries, meanwhile, are translated into Japanese yen at the average exchange rate for the fiscal year.<br />
Any translation differences are included in foreign currency translation adjustments in the net assets section <strong>of</strong> the balance sheet.<br />
(o) Income taxes<br />
Income taxes <strong>of</strong> the Company and its domestic consolidated subsidiaries consist <strong>of</strong> corporate income taxes, local inhabitants’ taxes and enterprise<br />
tax.<br />
The Company and its consolidated subsidiaries have adopted deferred tax accounting. Income taxes are determined using the asset and<br />
liability approach whereby deferred tax assets and liabilities are recognized in respect <strong>of</strong> the temporary differences between the tax bases <strong>of</strong> the<br />
assets and liabilities and those reported in the financial statements.<br />
(p) Hedge accounting<br />
Gain or loss on derivatives positions designated as hedging instruments is deferred until the gain or loss on the underlying hedged item is recognized.<br />
In addition, if an interest-rate swap meets certain conditions, the interest expense is computed at a combined rate and recognized.<br />
(q) Amortization <strong>of</strong> goodwill and negative goodwill<br />
Goodwill is amortized in equal amounts over an appropriate period not to exceed 20 years.<br />
3. Change in Method <strong>of</strong> Accounting<br />
(Application <strong>of</strong> Partial Amendments to Accounting Standard for Retirement Benefits (Part 3))<br />
Effective from the year ended December 31, <strong>2010</strong>, the Company has applied the “Partial Amendments to Accounting Standard for Retirement<br />
Benefits (Part 3)” (ASBJ Statement No. 19, July 31, 2008).<br />
The application <strong>of</strong> this accounting standard had no effect on operating income, or income before income taxes and minority interests for the<br />
fiscal year under review.<br />
(Change in standard for posting balance and cost <strong>of</strong> completed construction work)<br />
Regarding the standard for posting pr<strong>of</strong>it related to contracted construction work, effective from the year ended December 31, <strong>2010</strong>, the<br />
Company has applied “Accounting Standard for Construction Contracts” (ASBJ Statement No. 15, December 27, 2007) and “Guidance on<br />
Accounting Standard for Construction Contracts” (ASBJ Statement No. 18, December 27, 2007). For all construction work contracts, including<br />
those present at the beginning <strong>of</strong> the fiscal year, the Company has applied the percentage-<strong>of</strong>-completion method (cost-to-cost method used to<br />
estimate progress rate for construction work) with respect to the portion <strong>of</strong> ascertainable progress made on such construction work by the end<br />
<strong>of</strong> the fiscal year. For other construction work, the Company has applied the completed-contract method.<br />
This change had a negligible effect on income for the fiscal year under review.<br />
Refer to 17. Segment (11) for specific information on the impact <strong>of</strong> this change on segment information.<br />
(Accounting Standard for Measurement <strong>of</strong> Inventories)<br />
Effective from the year ended December 31, 2009, the Company has applied the “Accounting Standard for Measurement <strong>of</strong> Inventories” (ASBJ<br />
Statement No. 9, issued July 5, 2006). Accordingly, the Company has switched its standard for measuring inventories from the acquisition cost<br />
method to measurement at cost (as calculated by writing down the carrying value on balance sheets to reflect a decline in pr<strong>of</strong>itability). As a<br />
result <strong>of</strong> this change, in the year ended December 31, 2009, operating income was ¥829 million lower, and income before income taxes and<br />
minority interests were ¥48 million lower than would have been reported previously. Please see “17. Segment Information (7)” for details on the<br />
impact <strong>of</strong> this change on each segment.<br />
(Application <strong>of</strong> “Practical Solution on Unification <strong>of</strong> Accounting Policies Applied to Foreign Subsidiaries for Consolidated Financial Statements”)<br />
Effective from the year ended December 31, 2009, the Company has applied the “Practical Solution on Unification <strong>of</strong> Accounting Policies Applied<br />
to Foreign Subsidiaries for Consolidated Financial Statements” (PITF No. 18, issued May 17, 2006), and has made all necessary adjustments to<br />
its consolidated financial statements. In accordance with this change, the Company amortized goodwill recorded at foreign subsidiaries.<br />
Consequently, in the year ended December 31, 2009, both operating income and income before income taxes and minority interests were ¥376<br />
million lower than would have been reported previously. Please see “17. Segment Information (8)” for details on the impact <strong>of</strong> this change on<br />
each segment. Additionally, amortization <strong>of</strong> goodwill for prior years has been deducted from retained earnings. Consequently, retained earnings<br />
at the fiscal year-end were ¥1,477 million lower than would have been reported previously.<br />
SAPPORO HOLDINGS LIMITED<br />
<strong>Annual</strong> <strong>Report</strong> <strong>2010</strong><br />
39
(Accounting Standard for Leasing Transactions)<br />
Effective from the year ended December 31, 2009, the Company has applied the “Accounting Standard for Leasing Transactions” (ASBJ<br />
Statement No. 13, issued June 17, 1993; 1st Committee, Business Accounting Council; Revised March 30, 2007) and “Guidance on Accounting<br />
Standard for Lease Transactions” (ASBJ Statement Guidance No. 16, issued January 18, 1994; Accounting System Committee, Japanese<br />
Institute <strong>of</strong> Certified Public Accountants; revised March 30, 2007). Consequently, lease transactions have been accounted for in the same way<br />
as ordinary purchase and sales transactions. Finance leases other than those that transfer ownership <strong>of</strong> the leased assets to the lessees,<br />
entered into on or before December 31, 2008, continue to be treated in the same way as ordinary operating leases for accounting purposes.<br />
This change had a negligible impact on earnings.<br />
(Recognition <strong>of</strong> net sales)<br />
Effective from the year ended December 31, 2008, sales incentives paid to clients (wholesalers and retailers) corresponding to retail prices for<br />
s<strong>of</strong>t drinks and other non-alcoholic beverages have been deducted from net sales. Previously, these incentives were treated as selling, general<br />
and administrative (SG&A) expenses.<br />
In recent years, competition in the retail market for s<strong>of</strong>t drinks and other non-alcoholic beverages has escalated mainly because <strong>of</strong> stronger<br />
corporate affiliations and consolidation in the wholesale and retail sectors. In this context, clients have called for larger price discounts. As a<br />
result, the payment <strong>of</strong> sales incentives to clients based on retail prices, which are effectively discounts on retail prices, has become common in<br />
the industry.<br />
To break down aggregate sales incentives for s<strong>of</strong>t drinks and other non-alcoholic beverages by client, product and other categories, the<br />
Company has developed an invoice management system to classify sales incentives into amounts attributable to sales price discounts and<br />
selling expenses.<br />
Effective from the year ended December 31, 2008, the Company and the consolidated subsidiaries have adopted a new accounting method<br />
to ensure that revenues and expenses are more properly categorized in line with the new invoice management system. Under the new method,<br />
sales incentives attributable to retail price discounts are deducted from net sales.<br />
As a result <strong>of</strong> this change, net sales and operating expenses were both ¥6,629 million lower than would have been recorded previously, but<br />
there was no effect on operating income.<br />
(Liabilities arising from gift vouchers, etc.)<br />
Effective from the year ended December 31, 2008, the Company and the consolidated subsidiaries have applied the “Position Statement on the<br />
Auditing Treatment <strong>of</strong> Reserves Stipulated in the Special Tax Measures Act, Statutory Allowances or Reserves, and Reserves for Directors’<br />
Retirement Benefits” (Japanese Institute <strong>of</strong> Certified Public Accountants; Auditing and Assurance Practice Committee No. 42, April 13, 2007).<br />
Accordingly, the Company and the consolidated subsidiaries have started recording the estimated value <strong>of</strong> unredeemed gift vouchers after a<br />
certain time has elapsed under “Deposits received” on the balance sheet. Previously, the unredeemed gift vouchers were credited to income<br />
after a certain time had elapsed.<br />
As a result <strong>of</strong> this change, the Company and the consolidated subsidiaries recorded a provision for gift voucher redemptions <strong>of</strong> ¥746 million<br />
under extraordinary losses in the year ended December 31, 2008.<br />
(Translation <strong>of</strong> revenues and expenses <strong>of</strong> foreign subsidiaries and other entities)<br />
Effective from the year ended December 31, 2008, the Company and the consolidated subsidiaries have adopted a new accounting method<br />
for translating revenues and expenses <strong>of</strong> foreign subsidiaries and other entities into Japanese yen. Under the new method, revenues and<br />
expenses are translated into Japanese yen at the average exchange rate for the fiscal year, not the prevailing exchange rate on the balance<br />
sheet date as before.<br />
This change was made to ensure that translations <strong>of</strong> revenues and expenses <strong>of</strong> foreign subsidiaries and other entities more truly portray the<br />
Company and the consolidated subsidiaries’ operating results and financial position. This entails translation <strong>of</strong> revenues and expenses at the<br />
average exchange rate, which is not susceptible to temporary forex fluctuations. The change reflected the increasing importance <strong>of</strong> foreign subsidiaries<br />
and other entities, and the likelihood <strong>of</strong> fluctuations in prevailing exchange rates on the balance sheet date distorting the presentation<br />
<strong>of</strong> the Company and the consolidated subsidiaries’ operating results and financial position.<br />
As a result <strong>of</strong> this change, net sales and operating income were ¥5,207 million and ¥199 million higher, respectively, than would have been<br />
recorded previously. Income before income taxes and minority interests and net income was ¥324 million and ¥392 million lower, respectively,<br />
on the same basis.<br />
SAPPORO HOLDINGS LIMITED<br />
40 <strong>Annual</strong> <strong>Report</strong> <strong>2010</strong>
4. Inventories<br />
Inventories at December 31, <strong>2010</strong> and 2009 are summarized as follows:<br />
Millions <strong>of</strong> yen<br />
Thousands <strong>of</strong><br />
U.S. dollars (Note 1)<br />
<strong>2010</strong> 2009 <strong>2010</strong><br />
Finished goods and merchandise . . . . . . . . . . . . . . . . . . . . . . . . . . . . . . . . . . . . . . . . . . . . . . . . . . ¥ 8,132 ¥ 8,213 $ 99,855<br />
Real estate for sale. . . . . . . . . . . . . . . . . . . . . . . . . . . . . . . . . . . . . . . . . . . . . . . . . . . . . . . . . . . . . . . 205 594 2,512<br />
Work in process . . . . . . . . . . . . . . . . . . . . . . . . . . . . . . . . . . . . . . . . . . . . . . . . . . . . . . . . . . . . . . . . . 4,076 4,452 50,049<br />
Raw materials . . . . . . . . . . . . . . . . . . . . . . . . . . . . . . . . . . . . . . . . . . . . . . . . . . . . . . . . . . . . . . . . . . 9,107 9,094 111,820<br />
Supplies . . . . . . . . . . . . . . . . . . . . . . . . . . . . . . . . . . . . . . . . . . . . . . . . . . . . . . . . . . . . . . . . . . . . . . . 650 596 7,976<br />
¥22,169 ¥22,949 $272,213<br />
5. Loss on Impairment <strong>of</strong> Property, Plant and Equipment<br />
The Company and the consolidated subsidiaries recorded impairment losses on the following asset groups for the years ended December 31,<br />
<strong>2010</strong>, 2009 and 2008:<br />
Year ended December 31, <strong>2010</strong><br />
Location Use Classification Millions <strong>of</strong> yen<br />
Thousands <strong>of</strong><br />
U.S. dollars (Note 1)<br />
Sapporo Breweries Ltd. Real estate for lease Buildings ¥ 409 $ 5,027<br />
(Nasu-gun, Tochigi and other)<br />
and other<br />
¥ 409 $ 5,027<br />
Sapporo Lion Ltd. Restaurants Buildings ¥ 542 $ 6,656<br />
Restaurants for business (Minato-ku, Tokyo and other) for operations Machinery 50 616<br />
Other 33 403<br />
¥ 625 $ 7,675<br />
Yebisu Garden Place Co., Ltd. Real estate for lease Buildings ¥ 156 $ 1,914<br />
(Sapporo-shi, Hokkaido)<br />
and other<br />
¥ 156 $ 1,914<br />
SLEEMAN BREWERIES LTD. Other Goodwill ¥1,123 $13,795<br />
(Ontario, Canada) Other 61 746<br />
¥1,184 $14,541<br />
¥2,375 $29,157<br />
The Company and the consolidated subsidiaries decided the asset group in consideration <strong>of</strong> the division in management accounting. The idle<br />
estate and the real estate for lease are grouped with each estate, and the restaurants are mainly grouped with each store.<br />
Real estate for leasing has been written down to the recoverable amount as it is expected to be difficult to recover the investment due to<br />
declining pr<strong>of</strong>itability. An impairment loss has been booked for the amount <strong>of</strong> the write-down.<br />
For restaurants for operations, the amount by which the carrying amount <strong>of</strong> these assets exceeds the expected present value <strong>of</strong> these assets<br />
is recognized as an impairment loss because the carrying amount <strong>of</strong> these assets may not be recoverable due to a weak performance in pr<strong>of</strong>itability.<br />
The recoverable amount is measured by the value in use. The value in use is based on future cash flows discounted by 7.6%.<br />
SAPPORO HOLDINGS LIMITED<br />
<strong>Annual</strong> <strong>Report</strong> <strong>2010</strong><br />
41
Year ended December 31, 2009<br />
Location Use Classification Millions <strong>of</strong> yen<br />
Sapporo Breweries Ltd. Real estate for lease Land ¥117<br />
(Urayasu-shi, Chiba and other) Buildings 278<br />
Other 4<br />
¥399<br />
Sapporo Lion Ltd. Restaurants Buildings ¥461<br />
Restaurants for business (Minato-ku, Tokyo and other) for operations Machinery 41<br />
Other 25<br />
¥527<br />
¥926<br />
The Company and the consolidated subsidiaries decided the asset group in consideration <strong>of</strong> the division in management accounting. The idle<br />
estate and the real estate for lease are grouped with each estate, and the restaurants are mainly grouped with each store.<br />
Real estate for leasing has been written down to the recoverable amount as it is expected to be difficult to recover the investment due to<br />
declining pr<strong>of</strong>itability. An impairment loss has been booked for the amount <strong>of</strong> the write-down.<br />
For restaurants for operations, the amount by which the carrying amount <strong>of</strong> these assets exceeds the expected present value <strong>of</strong> these assets is<br />
recognized as an impairment loss because the carrying amount <strong>of</strong> these assets may not be recoverable due to a weak performance in pr<strong>of</strong>itability.<br />
The recoverable amount is measured by the value in use. The value in use is based on future cash flows discounted by 8.2%.<br />
Year ended December 31, 2008<br />
Location Use Classification Millions <strong>of</strong> yen<br />
Sapporo Beverage Co., Ltd.<br />
(Shibuya-ku, Tokyo)<br />
Property for S<strong>of</strong>t Drink<br />
business<br />
Buildings ¥ 23<br />
Lease 968<br />
Other 259<br />
¥1,250<br />
Sapporo Lion Ltd. Restaurants Buildings ¥ 283<br />
Restaurants for business (Chitose-shi, Hokkaido and other) for operations Machinery 19<br />
Other 17<br />
¥ 320<br />
Yebisu Garden Place Co., Ltd. Real estate for lease Buildings ¥ 17<br />
Sapporo Factory (Sapporo-shi, Hokkaido)<br />
¥ 17<br />
SLEEMAN BREWERIES LTD. Other Goodwill ¥6,620<br />
(Ontario, Canada)<br />
and other<br />
¥6,620<br />
¥8,207<br />
It is expected to be difficult to recover the investment in property for the s<strong>of</strong>t drinks business due to declining pr<strong>of</strong>itability. These assets have<br />
therefore been written down to their recoverable amount and an impairment loss booked for the amount equivalent to the write-down.<br />
For restaurants for operations, the amount by which the carrying amount <strong>of</strong> these assets exceeds the expected present value <strong>of</strong> these assets is<br />
recognized as an impairment loss because the carrying amount <strong>of</strong> these assets may not be recoverable due to a weak performance in pr<strong>of</strong>itability.<br />
A recoverable amount has been calculated for Sapporo Factory due to the planned transfer <strong>of</strong> this asset to a subsidiary. An impairment loss has<br />
been booked for the amount expected to be difficult to recover. The recoverable amount is measured by the net selling price and the value in use.<br />
The net selling price is based on the estimated value by the trust bank and the value in use is based on the future cash flows discounted by 5.7%.<br />
The Company and the consolidated subsidiaries have booked an impairment loss on goodwill <strong>of</strong> SLEEMAN BREWERIES LTD. This follows a<br />
reappraisal <strong>of</strong> the corporate value <strong>of</strong> SLEEMAN BREWERIES LTD., which conducts business in North America, following higher equity risk premiums<br />
in the wake <strong>of</strong> the ongoing financial market turmoil since the second half <strong>of</strong> 2008. The recoverable amount for SLEEMAN BREWERIES LTD.<br />
was measured through a due diligence analysis <strong>of</strong> assets based on the reappraised corporate value.<br />
SAPPORO HOLDINGS LIMITED<br />
42 <strong>Annual</strong> <strong>Report</strong> <strong>2010</strong>
6. Shareholders’ Equity<br />
Retained earnings include a legal reserve provided in accordance with the provisions <strong>of</strong> the Commercial Code. This reserve is not available for<br />
the payment <strong>of</strong> dividends, but it may be used to reduce or eliminate a deficit by resolution <strong>of</strong> the shareholders or may be transferred to common<br />
stock by resolution <strong>of</strong> the Board <strong>of</strong> Directors.<br />
7. Other Income (Expenses)<br />
“Other income (expenses)—Other, net” for each <strong>of</strong> the three years in the period ended December 31, <strong>2010</strong> consisted <strong>of</strong> the following:<br />
Millions <strong>of</strong> yen<br />
Thousands <strong>of</strong><br />
U.S. dollars (Note 1)<br />
<strong>2010</strong> 2009 2008 <strong>2010</strong><br />
Gain on gift voucher redemptions . . . . . . . . . . . . . . . . . . . . . . . . . . . . . . . . . . . . ¥ 677 ¥ 532 ¥ – $ 8,316<br />
Equity in income <strong>of</strong> affiliates . . . . . . . . . . . . . . . . . . . . . . . . . . . . . . . . . . . . . . . . . 611 276 – 7,501<br />
Loss on disposal <strong>of</strong> inventories . . . . . . . . . . . . . . . . . . . . . . . . . . . . . . . . . . . . . . . – – (1,103) –<br />
Equity in loss <strong>of</strong> affiliates . . . . . . . . . . . . . . . . . . . . . . . . . . . . . . . . . . . . . . . . . . . . – – (1) –<br />
Gain on sales <strong>of</strong> property, plant and equipment . . . . . . . . . . . . . . . . . . . . . . . . . 16,576 948 25,893 203,532<br />
Gain on sales <strong>of</strong> investment securities . . . . . . . . . . . . . . . . . . . . . . . . . . . . . . . . . 645 20 21 7,917<br />
Reversal <strong>of</strong> provision for doubtful receivables . . . . . . . . . . . . . . . . . . . . . . . . . . . 62 – 11 758<br />
Reversal <strong>of</strong> removal costs . . . . . . . . . . . . . . . . . . . . . . . . . . . . . . . . . . . . . . . . . . . . 569 – – 6,987<br />
Compensation income from store closures . . . . . . . . . . . . . . . . . . . . . . . . . . . . . – – 111 –<br />
Loss on disposal <strong>of</strong> property, plant and equipment . . . . . . . . . . . . . . . . . . . . . . . (1,724) (1,524) (5,836) (21,163)<br />
Loss on sales <strong>of</strong> property, plant and equipment . . . . . . . . . . . . . . . . . . . . . . . . . (8,410) – – (103,261)<br />
Loss on impairment <strong>of</strong> property, plant and equipment. . . . . . . . . . . . . . . . . . . . (2,375) (926) (8,207) (29,157)<br />
Devaluation <strong>of</strong> marketable securities and investments . . . . . . . . . . . . . . . . . . . (1,246) (244) (747) (15,294)<br />
Provision for gift voucher redemptions . . . . . . . . . . . . . . . . . . . . . . . . . . . . . . . . – – (747) –<br />
Loss on revision <strong>of</strong> retirement benefit plan . . . . . . . . . . . . . . . . . . . . . . . . . . . . . – – (1,307) –<br />
Early retirement benefits . . . . . . . . . . . . . . . . . . . . . . . . . . . . . . . . . . . . . . . . . . . . – – (305) –<br />
Business reorganization costs . . . . . . . . . . . . . . . . . . . . . . . . . . . . . . . . . . . . . . . . (664) – (1,444) (8,157)<br />
Loss on devaluation <strong>of</strong> inventories . . . . . . . . . . . . . . . . . . . . . . . . . . . . . . . . . . . . – (125) – –<br />
Other. . . . . . . . . . . . . . . . . . . . . . . . . . . . . . . . . . . . . . . . . . . . . . . . . . . . . . . . . . . . . 226 (291) (306) 2,777<br />
¥ 4,948 ¥(1,334) ¥ 6,033 $ 60,755<br />
8. Contingent Liabilities<br />
Contingent liabilities at December 31, <strong>2010</strong> and 2009 are summarized as follows:<br />
Millions <strong>of</strong> yen<br />
Thousands <strong>of</strong><br />
U.S. dollars (Note 1)<br />
<strong>2010</strong> 2009 <strong>2010</strong><br />
Guarantee <strong>of</strong> loans, principally loans for employees’ housing . . . . . . . . . . . . . . . . . . . . . . . . . . . ¥1,069 ¥1,164 $13,130<br />
SAPPORO HOLDINGS LIMITED<br />
<strong>Annual</strong> <strong>Report</strong> <strong>2010</strong><br />
43
9. Leases<br />
(a) Finance leases<br />
i) Lessee<br />
Finance leases other than those that transfer ownership <strong>of</strong> the leased assets to the lessees<br />
Description <strong>of</strong> lease assets<br />
1 Property, plant and equipment<br />
Fixtures (other) for sales purposes and vending machines (other)<br />
2 Intangible fixed assets<br />
S<strong>of</strong>tware<br />
Finance leases other than those that transfer ownership <strong>of</strong> the leased assets to the lessees, entered into on or before December 31, 2008,<br />
continue to be treated in the same way as ordinary operating leases for accounting purposes. Details are summarized as follows:<br />
Acquisition costs:<br />
Millions <strong>of</strong> yen<br />
Thousands <strong>of</strong><br />
U.S. dollars (Note 1)<br />
<strong>2010</strong> 2009 <strong>2010</strong><br />
Machinery and vehicles . . . . . . . . . . . . . . . . . . . . . . . . . . . . . . . . . . . . . . . . . . . . . . . . . . . . . . . . ¥ 704 ¥ 828 $ 8,644<br />
Other . . . . . . . . . . . . . . . . . . . . . . . . . . . . . . . . . . . . . . . . . . . . . . . . . . . . . . . . . . . . . . . . . . . . . . . 6,695 10,703 82,212<br />
¥7,399 ¥11,531 $90,856<br />
Accumulated depreciation:<br />
Machinery and vehicles . . . . . . . . . . . . . . . . . . . . . . . . . . . . . . . . . . . . . . . . . . . . . . . . . . . . . . . . ¥ 531 ¥ 511 $ 6,526<br />
Other . . . . . . . . . . . . . . . . . . . . . . . . . . . . . . . . . . . . . . . . . . . . . . . . . . . . . . . . . . . . . . . . . . . . . . . 5,061 7,259 62,148<br />
¥5,593 ¥ 7,770 $68,674<br />
Accumulated loss on impairment:<br />
Machinery and vehicles . . . . . . . . . . . . . . . . . . . . . . . . . . . . . . . . . . . . . . . . . . . . . . . . . . . . . . . . – – –<br />
Other . . . . . . . . . . . . . . . . . . . . . . . . . . . . . . . . . . . . . . . . . . . . . . . . . . . . . . . . . . . . . . . . . . . . . . . 265 608 3,254<br />
¥ 265 ¥ 608 $ 3,254<br />
Net book value:<br />
Machinery and vehicles . . . . . . . . . . . . . . . . . . . . . . . . . . . . . . . . . . . . . . . . . . . . . . . . . . . . . . . . ¥ 172 ¥ 317 $ 2,118<br />
Other . . . . . . . . . . . . . . . . . . . . . . . . . . . . . . . . . . . . . . . . . . . . . . . . . . . . . . . . . . . . . . . . . . . . . . . 1,369 2,837 16,810<br />
¥1,541 ¥ 3,154 $18,928<br />
Lease payments relating to finance leases accounted for as operating leases amounted to ¥1,577 million ($19,369 thousand) and ¥2,076<br />
million, which equaled the corresponding depreciation on the respective leased assets computed by the straight-line method over the lease<br />
terms for the years ended December 31, <strong>2010</strong> and 2009, respectively.<br />
There was no recorded loss on impairment <strong>of</strong> leased assets for the years ended December 31, <strong>2010</strong> and 2009.<br />
The amount <strong>of</strong> depreciation was ¥343 million ($4,208 thousand) and ¥461 million for the years ended December 31, <strong>2010</strong> and 2009.<br />
Future minimum lease payments, including the interest portion thereon, subsequent to December 31, <strong>2010</strong> for finance lease transactions<br />
accounted for as operating leases are summarized as follows:<br />
Year ending December 31,<br />
Millions <strong>of</strong> yen<br />
Thousands <strong>of</strong><br />
U.S. dollars (Note 1)<br />
2011 . . . . . . . . . . . . . . . . . . . . . . . . . . . . . . . . . . . . . . . . . . . . . . . . . . . . . . . . . . . . . . . . . . . . . . . . . . . . . . . . . . . . . . . . ¥ 962 $11,809<br />
2012 and thereafter . . . . . . . . . . . . . . . . . . . . . . . . . . . . . . . . . . . . . . . . . . . . . . . . . . . . . . . . . . . . . . . . . . . . . . . . . . . . 845 10,372<br />
Total . . . . . . . . . . . . . . . . . . . . . . . . . . . . . . . . . . . . . . . . . . . . . . . . . . . . . . . . . . . . . . . . . . . . . . . . . . . . . . . . . . . . . . . . ¥1,806 $22,182<br />
SAPPORO HOLDINGS LIMITED<br />
44 <strong>Annual</strong> <strong>Report</strong> <strong>2010</strong>
(b) Operating leases<br />
Future minimum lease payments subsequent to December 31, <strong>2010</strong> for operating leases are summarized as follows:<br />
i) Lessee<br />
Year ending December 31,<br />
Millions <strong>of</strong> yen<br />
Thousands <strong>of</strong><br />
U.S. dollars (Note 1)<br />
2011 . . . . . . . . . . . . . . . . . . . . . . . . . . . . . . . . . . . . . . . . . . . . . . . . . . . . . . . . . . . . . . . . . . . . . . . . . . . . . . . . . . . . . . . . ¥2,484 $30,501<br />
2012 and thereafter . . . . . . . . . . . . . . . . . . . . . . . . . . . . . . . . . . . . . . . . . . . . . . . . . . . . . . . . . . . . . . . . . . . . . . . . . . . . 5,565 68,338<br />
Total . . . . . . . . . . . . . . . . . . . . . . . . . . . . . . . . . . . . . . . . . . . . . . . . . . . . . . . . . . . . . . . . . . . . . . . . . . . . . . . . . . . . . . . . ¥8,049 $98,839<br />
ii) Lessor<br />
Year ending December 31,<br />
Millions <strong>of</strong> yen<br />
Thousands <strong>of</strong><br />
U.S. dollars (Note 1)<br />
2011 . . . . . . . . . . . . . . . . . . . . . . . . . . . . . . . . . . . . . . . . . . . . . . . . . . . . . . . . . . . . . . . . . . . . . . . . . . . . . . . . . . . . . . . . ¥ 3,165 $ 38,860<br />
2012 and thereafter . . . . . . . . . . . . . . . . . . . . . . . . . . . . . . . . . . . . . . . . . . . . . . . . . . . . . . . . . . . . . . . . . . . . . . . . . . . . 17,621 216,369<br />
Total . . . . . . . . . . . . . . . . . . . . . . . . . . . . . . . . . . . . . . . . . . . . . . . . . . . . . . . . . . . . . . . . . . . . . . . . . . . . . . . . . . . . . . . . ¥20,786 $255,229<br />
10. Financial Instruments<br />
Effective from the year ended December 31, <strong>2010</strong>, the Company has applied the “revised Accounting Standard for Financial Instruments and its<br />
Implementation Guidance” (ASBJ Statement No. 10, March 10, 2008) and “Guidance on Disclosures about Fair Value <strong>of</strong> Financial Instruments”<br />
(ASBJ Guidance No. 19, March 10, 2008).<br />
1. Matters Related to Financial Instruments<br />
(1) Group policy regarding financial instruments<br />
The Sapporo Group procures the funds it requires mainly through borrowings from banks and the issue <strong>of</strong> corporate bonds. Any temporary surpluses<br />
are then invested in highly secure, highly liquid financial assets. Short-term operating capital is procured through bank loans and commercial<br />
paper. Derivatives are not used for speculative purposes, but rather are used mainly to mitigate exposure to risks stemming from exchange<br />
rate and interest rate volatility.<br />
(2) Breakdown <strong>of</strong> financial instruments and related risks<br />
Operating receivables, such as notes and accounts receivable, are exposed to customer credit risks. To cope with these risks, the Sapporo<br />
Group, in line with internal regulations, engages in due date control and balance management for each respective business partner.<br />
Marketable securities and investment securities mainly consist <strong>of</strong> stocks <strong>of</strong> companies with which the Group has business relations and the<br />
investment <strong>of</strong> temporary surpluses in bonds. These securities are exposed to risks stemming from market price volatility. The Sapporo Group<br />
periodically evaluates the market value <strong>of</strong> these stocks and bonds. The Group also makes long-term loans to business partners and other entities.<br />
Payables, such as notes and accounts payable, are operating liabilities and due for payment within one year.<br />
Short-term borrowings consist mainly <strong>of</strong> operating funds procured for business transactions. Long-term debt and corporate bonds are funds<br />
procured mainly for capital investment purposes. Long-term debt is exposed to risks stemming from interest-rate volatility. For certain long-term<br />
debt, the Sapporo Group uses derivative transactions (interest rate swaps) as a hedge against risks stemming from interest-rate volatility.<br />
Derivative transactions consist <strong>of</strong> forward foreign exchange contracts used to hedge against risks stemming from exchange-rate volatility<br />
related to operating receivables and payables denominated in foreign currencies, and interest rate swaps, which are used to hedge against risks<br />
stemming from interest-rate volatility associated with borrowings.<br />
(3) Risk management system for financial instruments<br />
1 Management <strong>of</strong> credit risks (risks associated with default, etc., by business partners)<br />
Regarding operating receivables and long-term loans, the Company and its major consolidated subsidiaries, in line with internal rules <strong>of</strong><br />
conduct at each company, periodically monitor the status <strong>of</strong> main business partners via the executive department <strong>of</strong> each business division.<br />
Along with managing due dates and balances for each partner, the Company and its major subsidiaries take steps to preventatively<br />
assess and minimize losses from instances in which the recovery <strong>of</strong> receivables or loans may become doubtful due to deterioration, etc.,<br />
in financial condition.<br />
In derivative transactions, the Company and its major subsidiaries, based on standards <strong>of</strong> internal control, only enter contracts with<br />
financial institutions possessing high credit ratings. These controls are followed as a rule to prevent the emergence <strong>of</strong> possible credit risks.<br />
SAPPORO HOLDINGS LIMITED<br />
<strong>Annual</strong> <strong>Report</strong> <strong>2010</strong><br />
45
2 Management <strong>of</strong> market risks (risks from exchange-rate and interest-rate volatility)<br />
With regard to operating receivables and payables denominated in foreign currencies, the Company and certain <strong>of</strong> its subsidiaries use<br />
forward foreign exchange contracts to limit to within a certain scope risks stemming from exchange-rate volatility. Interest rate swaps are<br />
also used to control volatility risks involved in the interest rates on borrowings.<br />
For marketable and investment securities, the Company and its major subsidiaries periodically assess the market value <strong>of</strong> the securities<br />
and the financial condition, etc. <strong>of</strong> the issuer (business partners), and, as necessary, review the holding status <strong>of</strong> such securities,<br />
taking into account their relationship with the business partner in question.<br />
Derivative transactions are executed and managed pursuant to standards <strong>of</strong> internal control. These controls clearly stipulate matters<br />
pertaining to derivatives, including their purpose, product range, transaction counterparties, settlement approval procedures, the segregation<br />
<strong>of</strong> duties within executive departments, and the system for reporting such transactions. The balance and status <strong>of</strong> income (loss) for<br />
derivative transactions is reported periodically to the Board <strong>of</strong> Directors.<br />
3 Management <strong>of</strong> liquidity risk associated with fund procurement (risk <strong>of</strong> failing to meet payment due dates)<br />
To minimize financial liabilities, the Sapporo Group has a cash management system (CMS) to centrally manage fund allocation to the<br />
Company and its significant subsidiaries. Financial divisions within the Group formulate plans for fund procurement and fund management<br />
in an effort to manage liquidity risk.<br />
(4) Supplementary Explanation <strong>of</strong> Matters Concerning Fair Value, Etc., <strong>of</strong> Financial Instruments<br />
Market value <strong>of</strong> financial instruments contains fair values that are rationally calculated in cases for which no market price is available. Because<br />
variable factors are incorporated into the calculation <strong>of</strong> this value, the adoption <strong>of</strong> different terms and assumptions can cause fair value to vary.<br />
Furthermore, notional amounts contracted in derivative transactions, as described in the notes pertaining to derivative transactions, are not a<br />
full expression <strong>of</strong> the market risk associated with derivative transactions.<br />
2. Matters Concerning Fair Value, Etc., <strong>of</strong> Financial Instruments<br />
Amounts, market value and their variances reported in the consolidated balance sheets for the fiscal year ended December 31, <strong>2010</strong> are as<br />
follows. Items for which the assessment <strong>of</strong> market value is not feasible were omitted.<br />
Millions <strong>of</strong> yen Thousands <strong>of</strong> U.S. dollars (Note 1)<br />
Carrying<br />
value<br />
Fair value<br />
Unrealized<br />
gain (loss)<br />
Carrying<br />
value<br />
Fair value<br />
Unrealized<br />
gain (loss)<br />
(1) Cash and cash equivalents . . . . . . . . . . . . . . . . . . . . . . . . . . . . . . . . . . ¥ 12,957 ¥ 12,957 – $ 159,103 $ 159,103 –<br />
(2) Notes and accounts receivable—trade . . . . . . . . . . . . . . . . . . . . . . . . 61,353 753,352<br />
Allowance for doubtful receivables . . . . . . . . . . . . . . . . . . . . . . . . . . . (81) (997)<br />
Sub total . . . . . . . . . . . . . . . . . . . . . . . . . . . . . . . . . . . . . . . . . . . . . . . . . 61,272 61,272 – 752,355 752,355 –<br />
(3) Marketable securities and Investment securities<br />
1 Held-to-maturity debt securities . . . . . . . . . . . . . . . . . . . . . . . . . . . 202 204 (2) 2,482 2,503 (22)<br />
2 Other securities . . . . . . . . . . . . . . . . . . . . . . . . . . . . . . . . . . . . . . . . . 23,368 23,368 – 286,932 286,932 –<br />
(4) Long-term loans receivable . . . . . . . . . . . . . . . . . . . . . . . . . . . . . . . . . 10,745 131,933<br />
Allowance for doubtful receivables . . . . . . . . . . . . . . . . . . . . . . . . . . . (195) (2,395)<br />
Sub total . . . . . . . . . . . . . . . . . . . . . . . . . . . . . . . . . . . . . . . . . . . . . . . . . 10,550 10,550 (0) 129,538 129,540 (2)<br />
Total assets . . . . . . . . . . . . . . . . . . . . . . . . . . . . . . . . . . . . . . . . . . . . . . . . . ¥108,349 ¥108,351 ¥ (2) $1,330,410 $1,330,433 $ (24)<br />
(1) Notes and accounts payable—trade . . . . . . . . . . . . . . . . . . . . . . . . . . 24,348 24,348 – $ 298,973 $ 298,973 –<br />
(2) Short-term bank loans . . . . . . . . . . . . . . . . . . . . . . . . . . . . . . . . . . . . . . 4,177 4,177 – 51,293 51,293 –<br />
(3) Liquor taxes payable . . . . . . . . . . . . . . . . . . . . . . . . . . . . . . . . . . . . . . . 34,253 34,253 – 420,594 420,594 –<br />
(4) Income taxes payable . . . . . . . . . . . . . . . . . . . . . . . . . . . . . . . . . . . . . . 1,819 1,819 – 22,331 22,331 –<br />
(5) Bonds . . . . . . . . . . . . . . . . . . . . . . . . . . . . . . . . . . . . . . . . . . . . . . . . . . . 52,000 52,920 (920) 638,507 649,804 (11,297)<br />
(6) Long-term bank debt . . . . . . . . . . . . . . . . . . . . . . . . . . . . . . . . . . . . . . 121,315 122,400 (1,086) 1,489,619 1,502,952 (13,333)<br />
Total liabilities . . . . . . . . . . . . . . . . . . . . . . . . . . . . . . . . . . . . . . . . . . . . . . . ¥237,912 ¥239,918 ¥ (2,006) $2,921,318 $2,945,947 $(24,630)<br />
(7) Derivative transactions . . . . . . . . . . . . . . . . . . . . . . . . . . . . . . . . . . . . . ¥ (11) ¥ (11) – $ (136) $ (136) –<br />
SAPPORO HOLDINGS LIMITED<br />
46 <strong>Annual</strong> <strong>Report</strong> <strong>2010</strong>
a) Methods for Determining Market Value <strong>of</strong> Financial Instruments and Matters Concerning Marketable Securities and Derivative Transactions<br />
<br />
(1) Cash and cash equivalents, (2) Notes and accounts receivable<br />
Book value is used since the variance between market value and book value is small due to the settlement <strong>of</strong> these accounts in the near future.<br />
(3) Marketable and investment securities<br />
In determining market value, the stock market price is used for stocks. In the absence <strong>of</strong> a market price quotation, fair value on public and<br />
corporate bonds is determined as follows. Such bonds are first sorted in sets according to maturity and credit rating. Yield on a government<br />
bond with a similar maturity or another appropriate indicator is then applied as a benchmark, and a spread taking into account credit rating<br />
and maturity <strong>of</strong> a set <strong>of</strong> bonds is added on top <strong>of</strong> the benchmark rate. This rate approximating future cash flow <strong>of</strong> that set <strong>of</strong> bonds is then<br />
applied as the discount rate in calculating the set’s present value. For matters pertaining to respective marketable securities to be held to<br />
maturity, refer to “11. Marketable Securities and Investment Securities” in the Notes to Consolidated Financial Statements.<br />
(4) Long-term loans receivable<br />
Within the Sapporo Group, the fair value <strong>of</strong> long-term loans receivable is calculated as follows. Loans are first sorted in sets according to<br />
maturity and credit risk. Yield on a government bond with a similar maturity or another appropriate indicator is then applied as a benchmark,<br />
and a spread taking into account credit risk and maturity <strong>of</strong> a set <strong>of</strong> loans is added on top the benchmark rate. This rate approximating future<br />
cash flow <strong>of</strong> that set <strong>of</strong> loans is then applied as the discount rate in calculating the set’s present value. The fair value <strong>of</strong> potentially doubtful<br />
receivables is calculated either at present value using the same discount rate formula, or based on the projected amount <strong>of</strong> collateral or<br />
guarantees deemed recoverable.<br />
<br />
(1) Accounts payable, (2) Short-term bank loans, (3) Liquor taxes payable, and (4) Income taxes payable<br />
Book value is used since the variance between market value and book value is small due to the short-term settlement <strong>of</strong> these accounts.<br />
(5) Corporate bonds<br />
The market value <strong>of</strong> bonds issued by the Company is calculated based on market price for bonds that have market prices.<br />
(6) Long-term debt<br />
For long-term debt, the method for determining fair value is to discount the sum total <strong>of</strong> the outstanding principal and interest by the estimated<br />
interest-rate cost <strong>of</strong> refinancing it. Some long-term debt with variable interest rates backed by interest rate swaps is subject to special<br />
treatment. The method for determining the fair value <strong>of</strong> variable-rate debt backed by interest rate swaps is to discount the sum total <strong>of</strong> the<br />
outstanding principal and net flow on interest rates by the estimated interest-rate cost <strong>of</strong> refinancing it.<br />
b) Financial Instruments for Which the Assessment <strong>of</strong> Market Value Is not Feasible<br />
Millions <strong>of</strong> yen<br />
Carrying value<br />
Thousands <strong>of</strong><br />
U.S. dollars (Note 1)<br />
Carrying value<br />
Unlisted stocks, etc. . . . . . . . . . . . . . . . . . . . . . . . . . . . . . . . . . . . . . . . . . . . . . . . . . . . . . . . . . . . . . . . . . . . . . . . . . . . ¥14,460 $177,550<br />
Bonds with stock acquisition rights . . . . . . . . . . . . . . . . . . . . . . . . . . . . . . . . . . . . . . . . . . . . . . . . . . . . . . . . . . . . . . 3,843 47,190<br />
Dealers’ deposits for guarantees . . . . . . . . . . . . . . . . . . . . . . . . . . . . . . . . . . . . . . . . . . . . . . . . . . . . . . . . . . . . . . . . . 31,936 392,141<br />
c) Estimate <strong>of</strong> Monetary Claims and Maturing Marketable Securities Due for Redemption After the Consolidated Account Settlement<br />
Millions <strong>of</strong> yen Thousands <strong>of</strong> U.S. dollars (Note 1)<br />
Inside one<br />
year<br />
After one<br />
year and<br />
inside five<br />
years<br />
After five<br />
years and<br />
inside ten<br />
years<br />
After ten<br />
years<br />
Inside one<br />
year<br />
After one<br />
year and<br />
inside five<br />
years<br />
After five<br />
years and<br />
inside ten<br />
years<br />
After ten<br />
years<br />
Cash and cash equivalents . . . . . . . . . . . . . . . . . . . . . . ¥12,957 – – – $159,103 – – –<br />
Notes and accounts receivable—trade . . . . . . . . . . . . 61,353 – – – 753,352 – – –<br />
Marketable securities and Investment securities<br />
Held-to-maturity debt securities . . . . . . . . . . . . . . . 2 200 – – 26 2,456 – –<br />
Long-term loans receivable . . . . . . . . . . . . . . . . . . . . . . 348 9,472 925 – 4,278 116,301 11,354 –<br />
¥74,661 ¥9,672 ¥925 – $916,759 $118,757 $11,354 –<br />
SAPPORO HOLDINGS LIMITED<br />
<strong>Annual</strong> <strong>Report</strong> <strong>2010</strong><br />
47
11. Marketable Securities and Investment Securities<br />
(a) Trading securities<br />
No relevant items as <strong>of</strong> December 31, <strong>2010</strong>.<br />
(b) Held-to-maturity debt securities<br />
The aggregate carrying value, fair value, gross unrealized gain and loss on held-to-maturity debt securities whose fair value was determinable at<br />
December 31, <strong>2010</strong> are summarized as follows:<br />
Millions <strong>of</strong> yen Thousands <strong>of</strong> U.S. dollars (Note 1)<br />
December 31, <strong>2010</strong><br />
Carrying<br />
value<br />
Fair value<br />
Unrealized<br />
gain (loss)<br />
Carrying<br />
value<br />
Fair value<br />
Unrealized<br />
gain (loss)<br />
Securities whose fair value exceeds their carrying value:<br />
Government and municipal bonds . . . . . . . . . . . . . . . . . . . . . . . . . . . . . . . . – – – – – –<br />
Corporate bonds . . . . . . . . . . . . . . . . . . . . . . . . . . . . . . . . . . . . . . . . . . . . . . . 200 202 2 2,456 2,477 22<br />
Other . . . . . . . . . . . . . . . . . . . . . . . . . . . . . . . . . . . . . . . . . . . . . . . . . . . . . . . . – – – – – –<br />
Subtotal . . . . . . . . . . . . . . . . . . . . . . . . . . . . . . . . . . . . . . . . . . . . . . . . . . . . . . . . ¥200 ¥202 ¥2 $2,456 $2,477 $22<br />
Securities whose carrying value exceeds their fair value:<br />
Government and municipal bonds . . . . . . . . . . . . . . . . . . . . . . . . . . . . . . . . ¥ 2 ¥ 2 – $ 26 $ 26 –<br />
Corporate bonds . . . . . . . . . . . . . . . . . . . . . . . . . . . . . . . . . . . . . . . . . . . . . . . – – – – – –<br />
Other . . . . . . . . . . . . . . . . . . . . . . . . . . . . . . . . . . . . . . . . . . . . . . . . . . . . . . . . – – – – – –<br />
Subtotal . . . . . . . . . . . . . . . . . . . . . . . . . . . . . . . . . . . . . . . . . . . . . . . . . . . . . . . . ¥ 2 ¥ 2 – $ 26 $ 26 –<br />
Total . . . . . . . . . . . . . . . . . . . . . . . . . . . . . . . . . . . . . . . . . . . . . . . . . . . . . . . . . . . ¥202 ¥204 ¥2 $2,482 $2,503 $22<br />
(c) Other securities<br />
The aggregate acquisition cost, carrying value, gross unrealized gain and loss on other securities whose fair value was determinable at<br />
December 31, <strong>2010</strong> are summarized as follows:<br />
Unlisted stocks have no discernable market price, making any assessment <strong>of</strong> market value unfeasible. Such stocks have subsequently been<br />
omitted from the chart <strong>of</strong> Other Securities below.<br />
Millions <strong>of</strong> yen Thousands <strong>of</strong> U.S. dollars (Note 1)<br />
December 31, <strong>2010</strong><br />
Carrying<br />
value<br />
Acquisition<br />
cost<br />
Unrealized<br />
gain (loss)<br />
Carrying<br />
value<br />
Acquisition<br />
cost<br />
Unrealized<br />
gain (loss)<br />
Securities whose carrying value exceeds their acquisition cost:<br />
Stock . . . . . . . . . . . . . . . . . . . . . . . . . . . . . . . . . . . . . . . . . . . . . . . . . . . . . . . . . ¥14,648 ¥ 7,683 ¥ 6,965 $179,860 $ 94,334 $ 85,525<br />
Debt securities . . . . . . . . . . . . . . . . . . . . . . . . . . . . . . . . . . . . . . . . . . . . . . . . – – – – – –<br />
Other . . . . . . . . . . . . . . . . . . . . . . . . . . . . . . . . . . . . . . . . . . . . . . . . . . . . . . . . – – – – – –<br />
Subtotal . . . . . . . . . . . . . . . . . . . . . . . . . . . . . . . . . . . . . . . . . . . . . . . . . . . . . . . . ¥14,648 ¥ 7,683 ¥ 6,965 $179,860 $ 94,334 $ 85,525<br />
Securities whose acquisition cost exceeds their carrying value:<br />
Stock . . . . . . . . . . . . . . . . . . . . . . . . . . . . . . . . . . . . . . . . . . . . . . . . . . . . . . . . . ¥ 8,624 ¥10,403 ¥(1,779) $105,898 $127,740 $(21,843)<br />
Debt securities . . . . . . . . . . . . . . . . . . . . . . . . . . . . . . . . . . . . . . . . . . . . . . . . – – – – – –<br />
Other . . . . . . . . . . . . . . . . . . . . . . . . . . . . . . . . . . . . . . . . . . . . . . . . . . . . . . . . 96 120 (24) 1,175 1,468 (294)<br />
Subtotal . . . . . . . . . . . . . . . . . . . . . . . . . . . . . . . . . . . . . . . . . . . . . . . . . . . . . . . . ¥ 8,720 ¥10,523 ¥(1,803) $107,073 $129,209 $(22,136)<br />
Total . . . . . . . . . . . . . . . . . . . . . . . . . . . . . . . . . . . . . . . . . . . . . . . . . . . . . . . . . . . ¥23,368 ¥18,205 ¥ 5,162 $286,932 $223,543 $ 63,389<br />
SAPPORO HOLDINGS LIMITED<br />
48 <strong>Annual</strong> <strong>Report</strong> <strong>2010</strong>
(d) The realized gain and loss on sales <strong>of</strong> other securities for each <strong>of</strong> the three years in the period ended December 31, <strong>2010</strong> are<br />
summarized as follows:<br />
Millions <strong>of</strong> yen<br />
Thousands <strong>of</strong><br />
U.S. dollars (Note 1)<br />
Sales . . . . . . . . . . . . . . . . . . . . . . . . . . . . . . . . . . . . . . . . . . . . . . . . . . . . . . . . . . . . . . . . . . . . . . . . . . . . . . . . . . . . . . . . ¥786 $9,654<br />
Gain on sales <strong>of</strong> securities . . . . . . . . . . . . . . . . . . . . . . . . . . . . . . . . . . . . . . . . . . . . . . . . . . . . . . . . . . . . . . . . . . . . . . 658 8,077<br />
Loss on sales <strong>of</strong> securities . . . . . . . . . . . . . . . . . . . . . . . . . . . . . . . . . . . . . . . . . . . . . . . . . . . . . . . . . . . . . . . . . . . . . . (12) (153)<br />
(e) Marketable securities that have been written down<br />
During the fiscal year ended December 31, <strong>2010</strong> the Company wrote down ¥104 million ($1,280 thousand) in shares classified as “Other securities.”<br />
In conducting this impairment measure, securities that had declined more than 50% in value, as <strong>of</strong> December 31, <strong>2010</strong>, <strong>of</strong> their acquisition<br />
cost were written down entirely. For securities that had declined between 30% and 50% in value <strong>of</strong> their acquisition cost, the Company investigated<br />
the stock’s recovery potential on a case-by-case basis, booking impairment losses as necessary.<br />
12. Derivatives<br />
Derivative transactions to which hedge accounting is applied<br />
(1) Currency-related<br />
December 31, <strong>2010</strong><br />
Millions <strong>of</strong> yen Thousands <strong>of</strong> U.S. dollars (Note 1)<br />
Hedge accounting method Hedging instrument Main hedged item<br />
Contracted<br />
amount<br />
Contract payable after<br />
amount one year<br />
Fair value<br />
Contracted<br />
amount<br />
Contract payable after<br />
amount one year<br />
Fair value<br />
Principle method Forward foreign exchange contract Accounts payable<br />
Purchase denomination: euro<br />
¥249 – ¥238 $3,058 – $2,923<br />
Total ¥249 – ¥238 $3,058 – $2,923<br />
(2) Interest rate-related<br />
December 31, <strong>2010</strong><br />
Millions <strong>of</strong> yen Thousands <strong>of</strong> U.S. dollars (Note 1)<br />
Hedge accounting method Hedging instrument Main hedged item<br />
Contracted<br />
amount<br />
Contract payable after<br />
amount one year<br />
Fair value<br />
Contracted<br />
amount<br />
Contract payable after<br />
amount one year<br />
Fair value<br />
Special treatment for<br />
Interest rate swap<br />
Long-term debt<br />
interest rate swaps<br />
Receive variable rate,<br />
pay fixed rate<br />
¥51,357 ¥46,357 – $630,611 $569,217 –<br />
¥51,357 ¥46,357 – $630,611 $569,217 –<br />
(Note) Interest rate swaps backing long-term debts as hedges are subject to special treatment. Their fair value is recorded in conjunction with the long-term debts they back.<br />
SAPPORO HOLDINGS LIMITED<br />
<strong>Annual</strong> <strong>Report</strong> <strong>2010</strong><br />
49
13. Short-term Bank Loans and Long-term Debt<br />
Short-term bank loans represent notes or overdrafts. The annual average interest rates applicable to short-term bank loans for the years ended<br />
December 31, <strong>2010</strong> and 2009 were 0.8% and 1.24%, respectively.<br />
Long-term debt at December 31, <strong>2010</strong> and 2009 is summarized as follows:<br />
Millions <strong>of</strong> yen<br />
Thousands <strong>of</strong><br />
U.S. dollars (Note 1)<br />
<strong>2010</strong> 2009 <strong>2010</strong><br />
1.85% bonds due 2011 . . . . . . . . . . . . . . . . . . . . . . . . . . . . . . . . . . . . . . . . . . . . . . . . . . . . . . . . . . . ¥ 10,000 ¥ 10,000 $ 122,790<br />
1.56% bonds due <strong>2010</strong> . . . . . . . . . . . . . . . . . . . . . . . . . . . . . . . . . . . . . . . . . . . . . . . . . . . . . . . . . . . – 10,000 –<br />
1.90% bonds due 2012 . . . . . . . . . . . . . . . . . . . . . . . . . . . . . . . . . . . . . . . . . . . . . . . . . . . . . . . . . . . 10,000 10,000 122,790<br />
1.87% bonds due 2011 . . . . . . . . . . . . . . . . . . . . . . . . . . . . . . . . . . . . . . . . . . . . . . . . . . . . . . . . . . . 10,000 10,000 122,790<br />
2.26% bonds due 2013 . . . . . . . . . . . . . . . . . . . . . . . . . . . . . . . . . . . . . . . . . . . . . . . . . . . . . . . . . . . 10,000 10,000 122,790<br />
0.96% bonds due 2015 . . . . . . . . . . . . . . . . . . . . . . . . . . . . . . . . . . . . . . . . . . . . . . . . . . . . . . . . . . . 12,000 – 147,348<br />
(Sapporo Beverage Co., Ltd.) Zero coupon convertible bonds with<br />
stock acquisition rights due 2015 . . . . . . . . . . . . . . . . . . . . . . . . . . . . . . . . . . . . . . . . . . . . . . . . . 3,843 3,843 47,190<br />
Loans from banks and insurance companies maturing from 2009 to 2018<br />
with weighted-average annual interest rates:<br />
<strong>2010</strong>—1.54%<br />
2009—1.70%<br />
Secured . . . . . . . . . . . . . . . . . . . . . . . . . . . . . . . . . . . . . . . . . . . . . . . . . . . . . . . . . . . . . . . . . . . . . . . 17,716 19,796 217,534<br />
Unsecured . . . . . . . . . . . . . . . . . . . . . . . . . . . . . . . . . . . . . . . . . . . . . . . . . . . . . . . . . . . . . . . . . . . . . 103,599 102,562 1,272,085<br />
177,158 176,201 2,175,316<br />
Less current portion . . . . . . . . . . . . . . . . . . . . . . . . . . . . . . . . . . . . . . . . . . . . . . . . . . . . . . . . . . . . . (43,912) (26,142) (539,199)<br />
¥133,245 ¥150,059 $1,636,117<br />
The outstanding balance <strong>of</strong> convertible bonds with stock acquisition rights at December 31, <strong>2010</strong> was as follows:<br />
Sapporo Beverage Co., Ltd. First Series <strong>of</strong> Unsecured Convertible Bonds With Stock Acquisition Rights<br />
Shares to be issued: Sapporo Beverage common stock<br />
<strong>Issue</strong> price for stock acquisition rights: Gratis<br />
Number <strong>of</strong> stock acquisition rights: 49<br />
Value <strong>of</strong> shares to be issued: ¥3,843 million<br />
Total value <strong>of</strong> shares to be issued upon exercise <strong>of</strong> stock acquisition rights: Not applicable<br />
Percentage <strong>of</strong> stock acquisition rights granted: 100%<br />
Exercise period <strong>of</strong> stock acquisition rights: From February 27, 2009 to February 26, 2015<br />
The conversion price for stock acquisition rights has been set so that the number <strong>of</strong> Sapporo Beverage shares underlying the stock acquisition<br />
rights shall represent a shareholding <strong>of</strong> around 49% on a fully diluted basis. The bondholders hold a put option, i.e. the right to sell some or<br />
all <strong>of</strong> the convertible bonds to the Company under certain conditions. Conversely, the Company holds a call option, i.e. the right to buy back<br />
some or all <strong>of</strong> the convertible bonds from the bondholders under certain conditions.<br />
As recorded in 19. Subsequent Events on page 56 <strong>of</strong> this report, the Company plans to buy back all the convertible bonds with stock acquisition<br />
rights after their conversion to stock.<br />
The aggregate annual maturities <strong>of</strong> long-term debt subsequent to December 31, <strong>2010</strong> are summarized as follows:<br />
Millions <strong>of</strong> yen<br />
Thousands <strong>of</strong><br />
U.S. dollars (Note 1)<br />
2011 . . . . . . . . . . . . . . . . . . . . . . . . . . . . . . . . . . . . . . . . . . . . . . . . . . . . . . . . . . . . . . . . . . . . . . . . . . . . . . . . . . . . . . . . ¥ 43,912 $ 539,199<br />
2012 . . . . . . . . . . . . . . . . . . . . . . . . . . . . . . . . . . . . . . . . . . . . . . . . . . . . . . . . . . . . . . . . . . . . . . . . . . . . . . . . . . . . . . . . 39,396 483,747<br />
2013 . . . . . . . . . . . . . . . . . . . . . . . . . . . . . . . . . . . . . . . . . . . . . . . . . . . . . . . . . . . . . . . . . . . . . . . . . . . . . . . . . . . . . . . . 24,559 301,562<br />
2014 . . . . . . . . . . . . . . . . . . . . . . . . . . . . . . . . . . . . . . . . . . . . . . . . . . . . . . . . . . . . . . . . . . . . . . . . . . . . . . . . . . . . . . . . 35,359 434,169<br />
2015 . . . . . . . . . . . . . . . . . . . . . . . . . . . . . . . . . . . . . . . . . . . . . . . . . . . . . . . . . . . . . . . . . . . . . . . . . . . . . . . . . . . . . . . . 22,514 276,453<br />
2016 and thereafter . . . . . . . . . . . . . . . . . . . . . . . . . . . . . . . . . . . . . . . . . . . . . . . . . . . . . . . . . . . . . . . . . . . . . . . . . . . . 11,417 140,187<br />
¥177,158 $2,175,316<br />
SAPPORO HOLDINGS LIMITED<br />
50 <strong>Annual</strong> <strong>Report</strong> <strong>2010</strong>
The assets pledged as collateral for short-term bank loans and long-term debt at December 31, <strong>2010</strong> and 2009 are summarized as follows:<br />
(a) Assets pledged as collateral<br />
Millions <strong>of</strong> yen<br />
Thousands <strong>of</strong><br />
U.S. dollars (Note 1)<br />
<strong>2010</strong> 2009 <strong>2010</strong><br />
Investment securities . . . . . . . . . . . . . . . . . . . . . . . . . . . . . . . . . . . . . . . . . . . . . . . . . . . . . . . . . . . . ¥3,950 ¥3,868 $48,497<br />
Other Investment . . . . . . . . . . . . . . . . . . . . . . . . . . . . . . . . . . . . . . . . . . . . . . . . . . . . . . . . . . . . . . . 80 80 982<br />
(b) Debt relating to the above pledged assets<br />
Millions <strong>of</strong> yen<br />
Thousands <strong>of</strong><br />
U.S. dollars (Note 1)<br />
<strong>2010</strong> 2009 <strong>2010</strong><br />
Short-term bank loans . . . . . . . . . . . . . . . . . . . . . . . . . . . . . . . . . . . . . . . . . . . . . . . . . . . . . . . . . . . – ¥ 3,000 –<br />
Long-term bank debt . . . . . . . . . . . . . . . . . . . . . . . . . . . . . . . . . . . . . . . . . . . . . . . . . . . . . . . . . . . . ¥17,716 19,796 $217,534<br />
In addition, total assets <strong>of</strong> Sapporo Canada Inc. in the amount <strong>of</strong> ¥33,058 million ($405,916 thousand) are pledged as collateral for longterm<br />
debt <strong>of</strong> ¥4,072 million ($50,000 thousand).<br />
14. Retirement Benefit Plans<br />
The Company and its domestic consolidated subsidiaries have defined benefit plans, i.e., welfare pension fund plans, tax-qualified pension plans<br />
and lump-sum payment plans covering substantially all employees. Additional benefits may be granted to employees according to the conditions<br />
under which termination occurs.<br />
As <strong>of</strong> December 31, <strong>2010</strong>, a total <strong>of</strong> 9 consolidated subsidiaries had lump-sum payment plans. The Company and consolidated subsidiary<br />
Sapporo Breweries Ltd. are joint participants in the Sapporo Breweries Pension Fund.<br />
Employees’ retirement benefits as <strong>of</strong> December 31, <strong>2010</strong> and 2009 are analyzed as follows:<br />
Millions <strong>of</strong> yen<br />
Thousands <strong>of</strong><br />
U.S. dollars (Note 1)<br />
<strong>2010</strong> 2009 <strong>2010</strong><br />
Retirement benefit obligation . . . . . . . . . . . . . . . . . . . . . . . . . . . . . . . . . . . . . . . . . . . . . . . . . . . . . ¥(43,646) ¥(43,688) $(535,927)<br />
Fair value <strong>of</strong> pension plan assets . . . . . . . . . . . . . . . . . . . . . . . . . . . . . . . . . . . . . . . . . . . . . . . . . . . 27,441 27,530 336,949<br />
(16,205) (16,158) (198,978)<br />
Unrecognized net retirement benefit obligation at transition . . . . . . . . . . . . . . . . . . . . . . . . . . . 7,529 9,035 92,450<br />
Unrecognized actuarial gain or loss . . . . . . . . . . . . . . . . . . . . . . . . . . . . . . . . . . . . . . . . . . . . . . . . 7,749 6,508 95,144<br />
Unrecognized past service cost . . . . . . . . . . . . . . . . . . . . . . . . . . . . . . . . . . . . . . . . . . . . . . . . . . . (6,264) (6,873) (76,912)<br />
Prepaid pension cost . . . . . . . . . . . . . . . . . . . . . . . . . . . . . . . . . . . . . . . . . . . . . . . . . . . . . . . . . . . . – – –<br />
Employees’ retirement benefits . . . . . . . . . . . . . . . . . . . . . . . . . . . . . . . . . . . . . . . . . . . . . . . . . . . ¥ (7,191) ¥ (7,488) $ (88,296)<br />
The Company and certain consolidated subsidiaries have recognized past service cost related to a change in the level <strong>of</strong> benefits <strong>of</strong>fered<br />
under their lump-sum retirement payment plans.<br />
The components <strong>of</strong> retirement benefit expenses for each <strong>of</strong> the three years in the period ended December 31, <strong>2010</strong> were as follows:<br />
Millions <strong>of</strong> yen<br />
Thousands <strong>of</strong><br />
U.S. dollars (Note 1)<br />
<strong>2010</strong> 2009 2008 <strong>2010</strong><br />
Service cost . . . . . . . . . . . . . . . . . . . . . . . . . . . . . . . . . . . . . . . . . . . . . . . . . . . . . . . ¥1,064 ¥1,141 ¥1,307 $13,068<br />
Interest cost . . . . . . . . . . . . . . . . . . . . . . . . . . . . . . . . . . . . . . . . . . . . . . . . . . . . . . . 893 887 977 10,968<br />
Expected return on plan assets . . . . . . . . . . . . . . . . . . . . . . . . . . . . . . . . . . . . . . . (691) (613) (774) (8,480)<br />
Amortization <strong>of</strong> net retirement benefit obligation at transition . . . . . . . . . . . . 1,506 1,575 1,528 18,495<br />
Amortization <strong>of</strong> actuarial gain or loss . . . . . . . . . . . . . . . . . . . . . . . . . . . . . . . . . . 803 1,036 475 9,856<br />
Amortization <strong>of</strong> past service cost . . . . . . . . . . . . . . . . . . . . . . . . . . . . . . . . . . . . . (609) (609) (570) (7,477)<br />
Loss on revision <strong>of</strong> retirement benefit plan . . . . . . . . . . . . . . . . . . . . . . . . . . . . . – – 1,307 –<br />
Other. . . . . . . . . . . . . . . . . . . . . . . . . . . . . . . . . . . . . . . . . . . . . . . . . . . . . . . . . . . . . 672 492 709 8,253<br />
“Other” includes early retirement benefits.<br />
¥3,639 ¥3,909 ¥4,960 $44,684<br />
SAPPORO HOLDINGS LIMITED<br />
<strong>Annual</strong> <strong>Report</strong> <strong>2010</strong><br />
51
The assumptions used in calculation <strong>of</strong> the above information for each <strong>of</strong> the three years in the period ended December 31, <strong>2010</strong> were<br />
as follows:<br />
<strong>2010</strong> 2009 2008<br />
Discount rate . . . . . . . . . . . . . . . . . . . . . . . . . . . . . . . . . . . . . . . . . . . . . . . . . . . . . . 2.0 – 2.1% 2.0 – 2.1% 2.00%<br />
Expected rate <strong>of</strong> return on plan assets . . . . . . . . . . . . . . . . . . . . . . . . . . . . . . . . . 2.5 – 3.0% 2.5 – 3.0% 2.5 – 3.0%<br />
Period <strong>of</strong> recognition <strong>of</strong> past service cost . . . . . . . . . . . . . . . . . . . . . . . . . . . . . . . 9 – 14 years 9 – 14 years 11 – 14 years<br />
Method <strong>of</strong> amortization . . . . . . . . . . . . . . . . . . . . . . . . . . . . . . . . . . . . . . . . . . . . . Straight-line method Straight-line method Straight-line method<br />
Period <strong>of</strong> recognition <strong>of</strong> actuarial gain or loss (amortized by the straight-line<br />
method over the average number <strong>of</strong> remaining years <strong>of</strong> service <strong>of</strong> the<br />
eligible employees commencing in the following year) . . . . . . . . . . . . . . . . . . 9 – 15 years 9 – 15 years 10 – 15 years<br />
Period <strong>of</strong> recognition <strong>of</strong> net retirement benefit obligation . . . . . . . . . . . . . . . . . 15 years 15 years 15 years<br />
15. Income Taxes<br />
Income taxes applicable to the Company and its domestic consolidated subsidiaries comprise corporation tax, inhabitants’ taxes and enterprise<br />
tax which, in the aggregate, resulted in a statutory tax rate <strong>of</strong> 40.7% for each <strong>of</strong> the three years in the period ended December 31, <strong>2010</strong>. The<br />
differences from the corresponding effective tax rates are due primarily to (1) the accounting policy <strong>of</strong> not providing for deferred income taxes<br />
arising from timing differences between financial and tax reporting for unschedulable temporary differences, and (2) certain expenses which are<br />
not deductible for income tax purposes.<br />
In <strong>2010</strong>, income tax accounted for 39.4% <strong>of</strong> income before income tax and minority interests. The difference between the statutory tax rate<br />
and the effective tax rate after the application <strong>of</strong> tax-effect accounting was less than 5% <strong>of</strong> the statutory tax rate. Consequently, any note regarding<br />
this difference has been omitted.<br />
The effective tax rates reflected in the consolidated statements <strong>of</strong> income for each <strong>of</strong> the two years in the period ended December 31, 2009<br />
differ from the corresponding statutory tax rates for the following reasons:<br />
2009 2008<br />
Statutory tax rates . . . . . . . . . . . . . . . . . . . . . . . . . . . . . . . . . . . . . . . . . . . . . . . . . . . . . . . . . . . . . . . . . . . . . . . 40.7% 40.7%<br />
Effect <strong>of</strong>:<br />
Disallowed expenses, including entertainment expenses . . . . . . . . . . . . . . . . . . . . . . . . . . . . . . . . . . . 2.9 1.4<br />
Dividends and other income deductible for income tax purposes . . . . . . . . . . . . . . . . . . . . . . . . . . . . . (0.6) (0.4)<br />
Inhabitants’ per capita taxes . . . . . . . . . . . . . . . . . . . . . . . . . . . . . . . . . . . . . . . . . . . . . . . . . . . . . . . . . . . . 2.3 1.1<br />
Unschedulable temporary differences . . . . . . . . . . . . . . . . . . . . . . . . . . . . . . . . . . . . . . . . . . . . . . . . . . . . 19.7 18.0<br />
Changes in valuation allowance . . . . . . . . . . . . . . . . . . . . . . . . . . . . . . . . . . . . . . . . . . . . . . . . . . . . . . . . . (13.9) (7.4)<br />
The tax rate difference <strong>of</strong> overseas subsidiary company . . . . . . . . . . . . . . . . . . . . . . . . . . . . . . . . . . . . . (2.3) 4.9<br />
Other, net . . . . . . . . . . . . . . . . . . . . . . . . . . . . . . . . . . . . . . . . . . . . . . . . . . . . . . . . . . . . . . . . . . . . . . . . . . . . 0.3 (0.6)<br />
Effective tax rates . . . . . . . . . . . . . . . . . . . . . . . . . . . . . . . . . . . . . . . . . . . . . . . . . . . . . . . . . . . . . . . . . . . . . . . 49.0% 57.6%<br />
SAPPORO HOLDINGS LIMITED<br />
52 <strong>Annual</strong> <strong>Report</strong> <strong>2010</strong>
The significant components <strong>of</strong> deferred tax assets and liabilities at December 31, <strong>2010</strong> and 2009 were as follows:<br />
Millions <strong>of</strong> yen<br />
Thousands <strong>of</strong><br />
U.S. dollars (Note 1)<br />
<strong>2010</strong> 2009 <strong>2010</strong><br />
Deferred tax assets:<br />
Property, plant and equipment . . . . . . . . . . . . . . . . . . . . . . . . . . . . . . . . . . . . . . . . . . . . . . . . . . . . ¥ 6,540 ¥ 7,915 $ 80,302<br />
Employees’ retirement benefits . . . . . . . . . . . . . . . . . . . . . . . . . . . . . . . . . . . . . . . . . . . . . . . . . . . 3,472 4,247 42,636<br />
Gift coupon income . . . . . . . . . . . . . . . . . . . . . . . . . . . . . . . . . . . . . . . . . . . . . . . . . . . . . . . . . . . . . 2,527 1,285 31,023<br />
Tax loss carryforwards . . . . . . . . . . . . . . . . . . . . . . . . . . . . . . . . . . . . . . . . . . . . . . . . . . . . . . . . . . . 1,970 5,594 24,195<br />
Investment securities . . . . . . . . . . . . . . . . . . . . . . . . . . . . . . . . . . . . . . . . . . . . . . . . . . . . . . . . . . . . 1,568 1,353 19,255<br />
Accrued expenses . . . . . . . . . . . . . . . . . . . . . . . . . . . . . . . . . . . . . . . . . . . . . . . . . . . . . . . . . . . . . . 1,338 2,541 16,435<br />
Accrued bonuses . . . . . . . . . . . . . . . . . . . . . . . . . . . . . . . . . . . . . . . . . . . . . . . . . . . . . . . . . . . . . . . 830 662 10,193<br />
Allowance for doubtful receivables . . . . . . . . . . . . . . . . . . . . . . . . . . . . . . . . . . . . . . . . . . . . . . . . . 673 759 8,275<br />
Other. . . . . . . . . . . . . . . . . . . . . . . . . . . . . . . . . . . . . . . . . . . . . . . . . . . . . . . . . . . . . . . . . . . . . . . . . . 2,710 2,135 33,282<br />
Gross deferred tax assets . . . . . . . . . . . . . . . . . . . . . . . . . . . . . . . . . . . . . . . . . . . . . . . . . . . . . . . . . 21,630 26,490 265,597<br />
Valuation allowance . . . . . . . . . . . . . . . . . . . . . . . . . . . . . . . . . . . . . . . . . . . . . . . . . . . . . . . . . . . . . (9,250) (9,733) (113,579)<br />
Total deferred tax assets . . . . . . . . . . . . . . . . . . . . . . . . . . . . . . . . . . . . . . . . . . . . . . . . . . . . . . . . . . 12,380 16,757 152,018<br />
Deferred tax liabilities:<br />
Reserve for advanced depreciation deduction, etc. . . . . . . . . . . . . . . . . . . . . . . . . . . . . . . . . . . . 12,356 13,297 151,722<br />
Property, plant and equipment . . . . . . . . . . . . . . . . . . . . . . . . . . . . . . . . . . . . . . . . . . . . . . . . . . . . 5,828 6,103 71,559<br />
Unrealized holding gain on securities . . . . . . . . . . . . . . . . . . . . . . . . . . . . . . . . . . . . . . . . . . . . . . 2,177 1,808 26,736<br />
Other. . . . . . . . . . . . . . . . . . . . . . . . . . . . . . . . . . . . . . . . . . . . . . . . . . . . . . . . . . . . . . . . . . . . . . . . . . 14 34 174<br />
Total deferred tax liabilities . . . . . . . . . . . . . . . . . . . . . . . . . . . . . . . . . . . . . . . . . . . . . . . . . . . . . . . 20,376 21,242 250,191<br />
Net deferred tax assets (liabilities), net . . . . . . . . . . . . . . . . . . . . . . . . . . . . . . . . . . . . . . . . . . . . . ¥(7,995) ¥(4,485) $ (98,173)<br />
16. Real Estate for Lease<br />
Effective from the year ended December 31, <strong>2010</strong>, the Company has applied the “Accounting Standard for Disclosures about Fair Value <strong>of</strong><br />
Investment and Rental Property” (ASBJ Statement No. 20, November 28, 2008) and the “Guidance on Accounting Standard for Disclosures<br />
about Fair Value <strong>of</strong> Investment and Rental Property” (ASBJ Guidance No. 23, November 28, 2008).<br />
Fiscal <strong>2010</strong> (Jan. 1, <strong>2010</strong> to Dec. 31, <strong>2010</strong>), the Company and certain consolidated subsidiaries own <strong>of</strong>fice buildings for rent and commercial<br />
facilities for rent (including land) in Tokyo and other areas.<br />
Rental income associated with real estate for rent in the fiscal year ended December 31, <strong>2010</strong>, was ¥6,098 million ($74,877 thousand).<br />
Significant earnings from rent are included under operating income; rental-related expenses are posted under operating expenses. The balance <strong>of</strong> real<br />
estate for rent recorded in the consolidated balance sheets, as well as variance during the fiscal year under review and fair value, are as follows:<br />
Millions <strong>of</strong> yen Thousands <strong>of</strong> U.S. dollars (Note 1)<br />
Balance at<br />
December<br />
31, 2009<br />
Change<br />
during <strong>2010</strong><br />
Balance at<br />
December<br />
31, <strong>2010</strong><br />
Fair value at<br />
December<br />
31, <strong>2010</strong><br />
Balance at<br />
December<br />
31, 2009<br />
Change<br />
during <strong>2010</strong><br />
Balance at<br />
December<br />
31, <strong>2010</strong><br />
Fair value at<br />
December<br />
31, <strong>2010</strong><br />
¥165,537 ¥8,064 ¥173,601 ¥313,812 $2,032,624 $99,021 $2,131,645 $3,853,296<br />
(Notes)<br />
1. Amounts posted in the consolidated balance sheets represent the acquisition cost after the deduction <strong>of</strong> cumulative depreciation.<br />
2. Of the differences noted during the fiscal year under review, the main increase was the acquisition <strong>of</strong> real estate <strong>of</strong> ¥13,268 million ($162,914 thousand); the main<br />
decrease was depreciation <strong>of</strong> ¥5,107 million ($62,706 thousand).<br />
3. Fair value at the end <strong>of</strong> the fiscal year under review is based primarily on real estate appraisals carried out by external appraisers.<br />
SAPPORO HOLDINGS LIMITED<br />
<strong>Annual</strong> <strong>Report</strong> <strong>2010</strong><br />
53
17. Segment Information<br />
Financial information by business segment is summarized as follows:<br />
Year ended or as <strong>of</strong> December 31, <strong>2010</strong><br />
Millions <strong>of</strong> yen<br />
Alcoholic<br />
beverages S<strong>of</strong>t drinks Restaurants Real estate Total<br />
General<br />
corporate and<br />
intercompany<br />
eliminations<br />
Consolidated<br />
Net sales . . . . . . . . . . . . . . . . . . . . . . . . . . . . . . . . . . . . . . ¥304,218 ¥34,439 ¥27,051 ¥ 23,537 ¥389,245 – ¥389,245<br />
Intra-group sales and transfers . . . . . . . . . . . . . . . . . . . 5,501 310 – 2,281 8,092 (8,092) –<br />
Total . . . . . . . . . . . . . . . . . . . . . . . . . . . . . . . . . . . . . . . . . 309,719 34,749 27,051 25,817 397,337 (8,092) 389,245<br />
Operating expenses . . . . . . . . . . . . . . . . . . . . . . . . . . . . 29,915 34,223 26,942 17,814 378,894 (5,053) 373,842<br />
Operating income (loss) . . . . . . . . . . . . . . . . . . . . . . . . . ¥ 9,804 ¥ 526 ¥ 109 ¥ 8,003 ¥ 18,442 ¥(3,039) ¥ 15,403<br />
Identifiable assets . . . . . . . . . . . . . . . . . . . . . . . . . . . . . . ¥266,355 ¥25,173 ¥12,525 ¥179,890 ¥483,943 ¥10,856 ¥494,798<br />
Depreciation and amortization . . . . . . . . . . . . . . . . . . . ¥ 15,446 ¥ 677 ¥ 681 ¥ 5,693 ¥ 22,497 ¥ 8 ¥ 22,504<br />
Loss on impairment . . . . . . . . . . . . . . . . . . . . . . . . . . . . ¥ 1,594 – ¥ 625 ¥ 156 ¥ 2,375 – ¥ 2,375<br />
Capital expenditures . . . . . . . . . . . . . . . . . . . . . . . . . . . ¥ 9,159 ¥ 1,368 ¥ 319 ¥ 11,719 ¥ 22,565 ¥ 7 ¥ 22,571<br />
Year ended or as <strong>of</strong> December 31, <strong>2010</strong><br />
Thousands <strong>of</strong> U.S. dollars (Note 1)<br />
Alcoholic<br />
beverages S<strong>of</strong>t drinks Restaurants Real estate Total<br />
General<br />
corporate and<br />
intercompany<br />
eliminations<br />
Consolidated<br />
Net sales . . . . . . . . . . . . . . . . . . . . . . . . . . . . . . . . . . . . . . $3,735,489 $422,874 $332,157 $ 289,007 $4,779,528 – $4,779,528<br />
Intra-group sales and transfers . . . . . . . . . . . . . . . . . . . 67,549 3,812 – 28,002 99,363 (99,363) –<br />
Total . . . . . . . . . . . . . . . . . . . . . . . . . . . . . . . . . . . . . . . . . 3,803,038 426,686 332,157 317,009 4,878,890 (99,363) 4,779,528<br />
Operating expenses . . . . . . . . . . . . . . . . . . . . . . . . . . . . 3,682,650 420,224 330,823 218,739 4,652,436 (62,043) 4,590,393<br />
Operating income (loss) . . . . . . . . . . . . . . . . . . . . . . . . . $ 120,388 $ 6,462 $ 1,334 $ 98,270 $ 226,454 $(37,320) $ 189,134<br />
Identifiable assets . . . . . . . . . . . . . . . . . . . . . . . . . . . . . . $3,270,570 $309,095 $153,798 $2,208,860 $5,942,322 $133,297 $6,075,619<br />
Depreciation and amortization . . . . . . . . . . . . . . . . . . . $ 189,655 $ 8,314 $ 8,359 $ 69,907 $ 276,235 $ 93 $ 276,328<br />
Loss on impairment . . . . . . . . . . . . . . . . . . . . . . . . . . . . $ 19,568 – $ 7,675 $ 1,914 $ 29,157 – $ 29,157<br />
Capital expenditures . . . . . . . . . . . . . . . . . . . . . . . . . . . $ 112,457 $ 16,801 $ 3,913 $ 143,898 $ 277,069 $ 86 $ 277,155<br />
Year ended or as <strong>of</strong> December 31, 2009<br />
Millions <strong>of</strong> yen<br />
Alcoholic<br />
beverages S<strong>of</strong>t drinks Restaurants Real estate Total<br />
General<br />
corporate and<br />
intercompany<br />
eliminations<br />
Consolidated<br />
Net sales . . . . . . . . . . . . . . . . . . . . . . . . . . . . . . . . . . . . . . ¥305,496 ¥30,746 ¥28,026 ¥ 23,267 ¥387,534 – ¥387,534<br />
Intra-group sales and transfers . . . . . . . . . . . . . . . . . . . 5,740 304 – 2,289 8,334 (8,334) –<br />
Total . . . . . . . . . . . . . . . . . . . . . . . . . . . . . . . . . . . . . . . . . 311,236 31,050 28,026 25,556 395,869 (8,334) 387,534<br />
Operating expenses . . . . . . . . . . . . . . . . . . . . . . . . . . . . 303,060 30,749 28,198 18,032 380,039 (5,400) 374,638<br />
Operating income (loss) . . . . . . . . . . . . . . . . . . . . . . . . . ¥ 8,176 ¥ 301 ¥ (172) ¥ 7,524 ¥ 15,830 ¥(2,934) ¥ 12,896<br />
Identifiable assets . . . . . . . . . . . . . . . . . . . . . . . . . . . . . . ¥290,324 ¥19,337 ¥13,670 ¥175,905 ¥499,236 ¥7,639 ¥506,875<br />
Depreciation and amortization . . . . . . . . . . . . . . . . . . . ¥ 15,220 ¥ 385 ¥ 776 ¥ 6,161 ¥ 22,542 ¥ 5 ¥ 22,547<br />
Loss on impairment . . . . . . . . . . . . . . . . . . . . . . . . . . . . ¥ 399 – ¥ 527 – ¥ 926 – ¥ 926<br />
Capital expenditures . . . . . . . . . . . . . . . . . . . . . . . . . . . ¥ 10,054 ¥ 1,466 ¥ 875 ¥ 11,073 ¥ 23,468 ¥ 17 ¥ 23,485<br />
SAPPORO HOLDINGS LIMITED<br />
54 <strong>Annual</strong> <strong>Report</strong> <strong>2010</strong>
Year ended or as <strong>of</strong> December 31, 2008<br />
Millions <strong>of</strong> yen<br />
Alcoholic<br />
beverages S<strong>of</strong>t drinks Restaurants Real estate Total<br />
General<br />
corporate and<br />
intercompany<br />
eliminations<br />
Consolidated<br />
Net sales . . . . . . . . . . . . . . . . . . . . . . . . . . . . . . . . . . . . . . ¥324,720 ¥36,849 ¥29,538 ¥23,452 ¥414,558 – ¥414,558<br />
Intra-group sales and transfers . . . . . . . . . . . . . . . . . . . 6,263 322 – 2,373 8,958 (8,958) –<br />
Total . . . . . . . . . . . . . . . . . . . . . . . . . . . . . . . . . . . . . . . . . 330,984 37,171 29,538 25,825 423,517 (8,958) 414,558<br />
Operating expenses . . . . . . . . . . . . . . . . . . . . . . . . . . . . 322,374 36,950 28,987 18,212 406,523 (6,650) 399,873<br />
Operating income (loss) . . . . . . . . . . . . . . . . . . . . . . . . . ¥ 8,610 ¥ 221 ¥ 551 ¥ 7,612 ¥ 16,994 ¥(2,308) ¥ 14,685<br />
Identifiable assets . . . . . . . . . . . . . . . . . . . . . . . . . . . . . . ¥307,517 ¥17,536 ¥14,739 ¥172,564 ¥512,356 ¥14,931 ¥527,287<br />
Depreciation and amortization . . . . . . . . . . . . . . . . . . . ¥ 14,125 ¥ 272 ¥ 779 ¥ 6,427 ¥ 21,604 ¥ 1 ¥ 21,605<br />
Loss on impairment . . . . . . . . . . . . . . . . . . . . . . . . . . . . ¥ 6,620 ¥ 1,250 ¥ 320 ¥ 17 ¥ 8,207 – ¥ 8,207<br />
Capital expenditures . . . . . . . . . . . . . . . . . . . . . . . . . . . ¥ 15,099 ¥ 999 ¥ 856 ¥ 12,420 ¥ 29,374 ¥ 4 ¥ 29,378<br />
1. The above business segment information has been prepared in accordance with an ordinance under the Securities and Exchange Law <strong>of</strong> Japan.<br />
2. (i) Unallocated operating expenses amounted to ¥3,045 million ($37,384 thousand), ¥2,979 million and ¥2,344 million for the years ended December 31, <strong>2010</strong>, 2009 and<br />
2008, respectively.<br />
(ii) Unallocated assets, which amounted to ¥25,358 million ($311,366 thousand), ¥21,583 million and ¥29,132 million at December 31, <strong>2010</strong>, 2009 and 2008, respectively,<br />
consisted principally <strong>of</strong> cash and cash equivalents, short-term and long-term investments and assets <strong>of</strong> general administration.<br />
3. Sales outside Japan and sales to overseas customers comprised less than 10% <strong>of</strong> the Company’s consolidated sales for each <strong>of</strong> the years ended December 31, <strong>2010</strong>,<br />
2009 and 2008. Accordingly, geographical segment information and overseas sales have not been disclosed.<br />
4. Depreciation and amortization, loss on impairment and capital expenditures include long-term prepaid expenses.<br />
5. Effective from the year ended December 31, 2008, the Company and the consolidated subsidiaries have adopted a new method for recognizing net sales. Under the new<br />
method, sales incentives paid to clients corresponding to retail prices for s<strong>of</strong>t drinks and other non-alcoholic beverages are deducted from net sales. As a result <strong>of</strong> this<br />
change, net sales and operating expenses were both ¥6,629 million lower than would have been recorded previously, but there was no impact on operating income.<br />
6. Effective from the year ended December 31, 2008, the Company and the consolidated subsidiaries have adopted a new method for translating revenues and expenses<br />
<strong>of</strong> foreign subsidiaries and other entities. Under the new method, these revenues and expenses are translated using the average exchange rate for the fiscal year. As a<br />
result <strong>of</strong> this change, net sales and operating income were ¥5,207 million and ¥199 million higher, respectively, than would have been recorded previously.<br />
7. Effective from the year ended December 31, 2009, the Company has applied the “Accounting Standard for Measurement <strong>of</strong> Inventories” (ASBJ Statement No. 9, issued<br />
July 5, 2006). Accordingly, the Company has switched its standard for measuring inventories from the acquisition cost method to measurement at cost (as calculated<br />
by writing down the carrying value on balance sheets to reflect a decline in pr<strong>of</strong>itability). As a result <strong>of</strong> this change, in the year ended December 31,2009, operating<br />
income was ¥607 million lower in the Alcoholic Beverages business, and ¥223 million lower in the S<strong>of</strong>t Drinks business than would have been reported previously.<br />
8. Effective from the year ended December 31, 2009, the Company has applied the “Practical Solution on Unification <strong>of</strong> Accounting Policies Applied to Foreign<br />
Subsidiaries for Consolidated Financial Statements” (PITF No. 18, issued May 17, 2006), and has made all necessary adjustments to its consolidated financial statements.<br />
In accordance with this change, the Company amortized goodwill recorded at foreign subsidiaries. Consequently, in the year ended December 31, 2009, operating<br />
income in the Alcoholic Beverages business was ¥376 million lower than would have been reported previously.<br />
9. Effective from the year ended December 31, 2009, the Company has applied the “Accounting Standard for Leasing Transactions” (ASBJ Statement No. 13, issued June<br />
17, 1993; 1st Committee, Business Accounting Council; Revised March 30, 2007) and Guidance on Accounting Standard for Lease Transactions (ASBJ Statement<br />
Guidance No. 16, issued January 18, 1994; Accounting System Committee, Japanese Institute <strong>of</strong> Certified Public Accountants; revised March 30, 2007). Consequently,<br />
lease transactions have been accounted for in the same way as ordinary purchase and sales transactions. Finance leases other than those that transfer ownership <strong>of</strong><br />
the leased assets to the lessees, entered into on or before December 31, 2008, continue to be treated in the same way as ordinary operating leases for accounting<br />
purposes. This change had a negligible impact on each segment.<br />
10. The Company and its consolidated subsidiaries in Japan have reviewed the useful lives <strong>of</strong> property, plant and equipment following the amendment <strong>of</strong> Japan’s<br />
Corporation Tax Act in the fiscal year ended March 31, 2008, and have revised the useful lives for depreciation <strong>of</strong> machinery assets. As a result <strong>of</strong> this revision, operating<br />
income was ¥1,554 million lower in the Alcoholic Beverages business, ¥0 million higher in the S<strong>of</strong>t Drinks business, and ¥1 million lower in the Real Estate business<br />
than would have been reported previously, while the operating loss in the Restaurants business was ¥14 million higher than would have been reported previously.<br />
11. Effective from the year ended December 31, <strong>2010</strong>, as detailed in the “Summary <strong>of</strong> Significant Accounting Policies,” the Company has applied “Accounting Standard for<br />
Construction Contracts” (ASBJ Statement No. 15, December 27, 2007) and “Guidance on Accounting Standard for Construction Contracts” (ASBJ Statement No. 18,<br />
December 27, 2007) as the standard for posting pr<strong>of</strong>it related to contracted construction work. For all construction work contracts, including those present at the<br />
beginning <strong>of</strong> the fiscal year, the Company has applied the percentage-<strong>of</strong>-completion method (cost-to-cost method used to estimate progress rate for construction work)<br />
with respect to the portion <strong>of</strong> ascertainable progress made on such construction work by the end <strong>of</strong> the fiscal year. For other construction work, the Company has<br />
applied the completed-contract method. This accounting change had a negligible effect on business segments.<br />
18. Amounts per Share<br />
Basic net income per share has been computed based on the net income available for distribution to shareholders <strong>of</strong> common stock and the<br />
weighted average number <strong>of</strong> shares <strong>of</strong> common stock outstanding during the year, and diluted net income per share has been computed based<br />
on the net income available for distribution to shareholders and the weighted average number <strong>of</strong> shares <strong>of</strong> common stock outstanding during the<br />
year after allowing for the dilutive potential <strong>of</strong> shares <strong>of</strong> common stock to be issued upon the conversion <strong>of</strong> convertible bonds. Amounts per<br />
share <strong>of</strong> net assets have been computed based on the net assets available for distribution to shareholders and the number <strong>of</strong> shares <strong>of</strong><br />
common stock outstanding at each balance sheet date.<br />
Yen U.S. dollars (Note 1)<br />
Year ended December 31 <strong>2010</strong> 2009 2008 <strong>2010</strong><br />
Net income . . . . . . . . . . . . . . . . . . . . . . . . . . . . . . . . . . . . . . . . . . . . . . . . . . . . . . . ¥27.50 ¥11.57 ¥19.49 $0.34<br />
Diluted net income . . . . . . . . . . . . . . . . . . . . . . . . . . . . . . . . . . . . . . . . . . . . . . . . . 26.44 11.05 18.89 0.32<br />
SAPPORO HOLDINGS LIMITED<br />
<strong>Annual</strong> <strong>Report</strong> <strong>2010</strong><br />
55
Yen U.S. dollars (Note 1)<br />
As <strong>of</strong> December 31 <strong>2010</strong> 2009 <strong>2010</strong><br />
Net assets . . . . . . . . . . . . . . . . . . . . . . . . . . . . . . . . . . . . . . . . . . . . . . . . . . . . . . . . . . . . . . . . . . . . . ¥319.32 ¥302.16 $3.92<br />
19. Subsequent Events<br />
(Appropriation <strong>of</strong> retained earnings)<br />
On March 30, 2011, the following appropriation <strong>of</strong> retained earnings was approved at the annual general meeting <strong>of</strong> the Company’s shareholders:<br />
Millions <strong>of</strong> yen<br />
Thousands <strong>of</strong><br />
U.S. dollars (Note 1)<br />
Cash dividends . . . . . . . . . . . . . . . . . . . . . . . . . . . . . . . . . . . . . . . . . . . . . . . . . . . . . . . . . . . . . . . . . . . . . . . . . . . . . . . ¥2,741 $33,659<br />
(Acquisition <strong>of</strong> POKKA CORPORATION)<br />
On February 10, 2011, the Board <strong>of</strong> Directors authorized the acquisition <strong>of</strong> additional shares and subsequent consolidation <strong>of</strong> POKKA<br />
CORPORATION, an affiliate <strong>of</strong> the Company since September 30, 2009. POKKA CORPORATION became a subsidiary <strong>of</strong> the Company on March<br />
29, 2011.<br />
Purpose <strong>of</strong> the Share Acquisition<br />
The Company has positioned “the creation <strong>of</strong> value in food” as one <strong>of</strong> the business domains <strong>of</strong> its New Management Framework set for realization<br />
by 2016. The additional acquisition <strong>of</strong> shares in POKKA CORPORATION will give shape to the Company’s vision <strong>of</strong> becoming a “food value<br />
creation group” with deep competitiveness in the alcoholic beverages, s<strong>of</strong>t drinks, food and restaurant fields in Japan and overseas.<br />
Share Acquisition Details<br />
1. Acquired company: POKKA CORPORATION<br />
2. Business lines and scale <strong>of</strong> acquired company<br />
Name: POKKA CORPORATION<br />
Business lines: Mineral water and food businesses, restaurant business, snack food business, logistics business, others<br />
Employees: 2,473 (as <strong>of</strong> March 31, <strong>2010</strong>)<br />
Consolidated net sales: ¥97,121 million (for the year ended March 31, <strong>2010</strong>)<br />
Consolidated total assets: ¥58,527 million (as <strong>of</strong> March 31, <strong>2010</strong>)<br />
3. Party acquiring shares: Advantage Partners, LLB MBI Fund No. 3, others<br />
4. Acquisition date: March 29, 2011<br />
5. Total number <strong>of</strong> shares scheduled for acquisition: 6,401,769 shares (65.9% <strong>of</strong> issued shares)<br />
6. Shareholding after acquisition: 86.8%<br />
7. Acquisition price: ¥22,406 million<br />
8. Fund procurement method: Primarily funds on hand and external borrowings, etc.<br />
9. Future plans:<br />
The Company will immediately establish a committee ahead <strong>of</strong> management integration to deliberate business and organizational realignment<br />
within the Group, the management structure <strong>of</strong> the holding company, corporate name, and other matters.<br />
(Convertible bonds with stock acquisition rights issued by a subsidiary)<br />
The former business alliance between the Company, YK, Crescent Partners and CRPBH, a fund managed by Crescent Partners (hereinafter, “the<br />
investors”), expired on February 10, 2011.<br />
With the expiration <strong>of</strong> this agreement, the Company plans to buy back all shares following the conversion to stock <strong>of</strong> convertible bonds with<br />
stock acquisition rights issued by Sapporo Beverage Co., Ltd. and held by the investors.<br />
(Impact <strong>of</strong> the Tohoku Pacific Earthquake)<br />
As a result <strong>of</strong> the Tohoku Pacific Earthquake on March 11, 2011, the Sendai Brewery (Natori, Miyagi Prefecture) and Chiba Brewery (Funabashi,<br />
Chiba Prefecture) <strong>of</strong> our consolidated group company Sapporo Breweries Ltd. suffered partial damage to buildings and equipment. The earthquake<br />
also affected some other plants <strong>of</strong> Sapporo Breweries Ltd. and <strong>of</strong> other group companies also. The amount <strong>of</strong> damage caused by the<br />
disaster is currently being assessed, and is not yet confirmed. At this time it is difficult to estimate the impact <strong>of</strong> the earthquake on our forecast<br />
for the year ending December 2011, for the reasons described below. We will disclose the information as soon as it can be estimated.<br />
– It is not clear to what extent total power consumption regulations will affect our production framework.<br />
– The cost <strong>of</strong> restoring damaged equipment and buildings to their original state has yet to be rationally estimated.<br />
– Macroeconomic and consumption trends are unclear.<br />
SAPPORO HOLDINGS LIMITED<br />
56 <strong>Annual</strong> <strong>Report</strong> <strong>2010</strong>
Corporate Data (As <strong>of</strong> December 31, <strong>2010</strong>)<br />
Company Name<br />
SAPPORO HOLDINGS LIMITED<br />
Business<br />
Holding company<br />
Date <strong>of</strong> Establishment<br />
September 1949<br />
Capital<br />
¥53,887 million<br />
Number <strong>of</strong> Shares <strong>Issue</strong>d<br />
393,971,493<br />
Fiscal Year-end<br />
December 31<br />
Head Office<br />
20-1, Ebisu 4-chome, Shibuya-ku,<br />
Tokyo 150-8522, Japan<br />
info@sapporoholdings.jp<br />
Number <strong>of</strong> Employees<br />
3,983<br />
(Consolidated)<br />
66<br />
(Parent company)<br />
Main Banks<br />
Mizuho Corporate Bank, Ltd.<br />
The Bank <strong>of</strong> Tokyo-Mitsubishi UFJ, Ltd.<br />
The Norinchukin Bank<br />
Securities Traded:<br />
Common Stock<br />
Tokyo Stock Exchange, First Section<br />
<strong>Annual</strong> Meeting <strong>of</strong><br />
Shareholders<br />
The annual meeting <strong>of</strong> shareholders <strong>of</strong> the<br />
Company is normally held in March each<br />
year in Tokyo, Japan. In addition, the<br />
Company may hold an extraordinary meeting<br />
<strong>of</strong> shareholders whenever necessary.<br />
Business Segments in <strong>2010</strong><br />
Alcoholic Beverages<br />
SAPPORO BREWERIES LTD.<br />
SAPPORO WINES LIMITED<br />
YEBISU WINEMART CO., LTD.<br />
SAPPORO LOGISTICS SYSTEMS CO., LTD.<br />
TANOSHIMARU SHUZO CO., LTD.<br />
SAPPORO ENGINEERING LIMITED<br />
STARNET CO., LTD.<br />
SAPPORO INTERNATIONAL INC.<br />
SAPPORO U.S.A., INC.<br />
SAPPORO CANADA INC.<br />
SLEEMAN BREWERIES LTD.<br />
SAPPORO ASIA PRIVATE LIMITED<br />
SAPPORO VIETNAM LIMITED<br />
S<strong>of</strong>t Drinks<br />
SAPPORO BEVERAGE CO., LTD.<br />
STELLA BEVERAGE SERVICE CO., LTD.<br />
STAR BEVERAGE SERVICE CO., LTD.<br />
SAPPORO FOODS NET CO., LTD<br />
SAPPORO FINE FOODS CO., LTD<br />
Restaurants<br />
SAPPORO LION LIMITED<br />
NEW SANKO INC.<br />
Real Estate<br />
YEBISU GARDEN PLACE CO., LTD.<br />
YGP REAL ESTATE CO., LTD.<br />
SAPPORO URBAN DEVELOPMENT CO., LTD.<br />
TOKYO ENERGY SERVICE CO., LTD.<br />
SAPPORO SPORTS PLAZA CO., LTD.<br />
YOKOHAMA KEIWA BUILDING CO., LTD.<br />
2011 Business Segment<br />
Japanese Alcoholic Beverages<br />
SAPPORO BREWERIES LTD.<br />
SAPPORO WINES LIMITED<br />
YEBISU WINEMART CO., LTD.<br />
SAPPORO LOGISTICS SYSTEMS CO., LTD.<br />
TANOSHIMARU SHUZO CO., LTD.<br />
SAPPORO ENGINEERING LIMITED<br />
STARNET CO., LTD.<br />
NEW SANKO INC.<br />
International Alcoholic Beverages<br />
SAPPORO INTERNATIONAL INC.<br />
SAPPORO U.S.A., INC.<br />
SAPPORO CANADA INC.<br />
SLEEMAN BREWERIES LTD.<br />
SAPPORO ASIA PRIVATE LIMITED<br />
SAPPORO VIETNAM LIMITED<br />
S<strong>of</strong>t Drinks<br />
SAPPORO BEVERAGE CO., LTD.<br />
STELLA BEVERAGE SERVICE CO., LTD.<br />
STAR BEVERAGE SERVICE CO., LTD.<br />
POKKA Group<br />
POKKA CORPORATION<br />
SUN POKKA CO., LTD.<br />
POKKA CREATE CO., LTD. and another 22 subsidiaries<br />
Restaurants<br />
SAPPORO LION LIMITED<br />
Real Estate<br />
YEBISU GARDEN PLACE CO., LTD.<br />
YGP REAL ESTATE CO., LTD.<br />
SAPPORO URBAN DEVELOPMENT CO., LTD.<br />
TOKYO ENERGY SERVICE CO., LTD.<br />
SAPPORO SPORTS PLAZA CO., LTD.<br />
YOKOHAMA KEIWA BUILDING CO., LTD.<br />
Others<br />
SAPPORO FOODS NET CO., LTD<br />
SAPPORO FINE FOODS CO., LTD<br />
SAPPORO GROUP MANAGEMENT LTD.<br />
SAPPORO HOLDINGS LIMITED<br />
<strong>Annual</strong> <strong>Report</strong> <strong>2010</strong><br />
57
SAPPORO HOLDINGS LIMITED<br />
20-1, Ebisu 4-chome, Shibuya-ku,<br />
Tokyo 150-8522, Japan<br />
http://www.sapporoholdings.jp/english/<br />
Printed with VOC (volatile organic compound)-free vegetable oil-based ink using<br />
waterless printing that generates no hazardous waste fluids.<br />
Printed in Japan