Issue of Annual Report 2010
Issue of Annual Report 2010
Issue of Annual Report 2010

You also want an ePaper? Increase the reach of your titles
YUMPU automatically turns print PDFs into web optimized ePapers that Google loves.
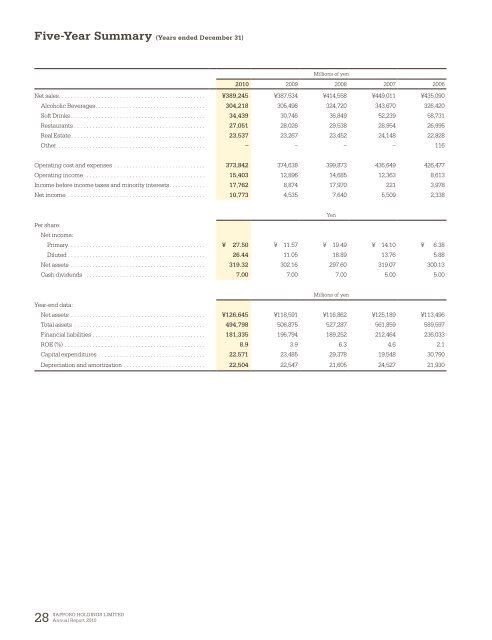
Five-Year Summary (Years ended December 31)<br />
Millions <strong>of</strong> yen<br />
<strong>2010</strong> 2009 2008 2007 2006<br />
Net sales ¥389,245 ¥387,534 ¥414,558 ¥449,011 ¥435,090<br />
Alcoholic Beverages 304,218 305,496 324,720 343,670 326,420<br />
S<strong>of</strong>t Drinks 34,439 30,746 36,849 52,239 58,731<br />
Restaurants 27,051 28,026 29,538 28,954 26,995<br />
Real Estate 23,537 23,267 23,452 24,148 22,828<br />
Other – – – – 116<br />
Operating cost and expenses 373,842 374,638 399,873 436,649 426,477<br />
Operating income 15,403 12,896 14,685 12,363 8,613<br />
Income before income taxes and minority interests 17,762 8,874 17,970 221 3,978<br />
Net income 10,773 4,535 7,640 5,509 2,338<br />
Yen<br />
Per share:<br />
Net income:<br />
Primary ¥ 27.50 ¥ 11.57 ¥ 19.49 ¥ 14.10 ¥ 6.38<br />
Diluted 26.44 11.05 18.89 13.76 5.88<br />
Net assets 319.32 302.16 297.60 319.07 300.13<br />
Cash dividends 7.00 7.00 7.00 5.00 5.00<br />
Millions <strong>of</strong> yen<br />
Year-end data:<br />
Net assets ¥126,645 ¥118,591 ¥116,862 ¥125,189 ¥113,496<br />
Total assets 494,798 506,875 527,287 561,859 589,597<br />
Financial liabilities 181,335 196,794 189,252 212,464 236,033<br />
ROE (%) 8.9 3.9 6.3 4.6 2.1<br />
Capital expenditures 22,571 23,485 29,378 19,548 30,790<br />
Depreciation and amortization 22,504 22,547 21,605 24,527 21,930<br />
28<br />
SAPPORO HOLDINGS LIMITED<br />
<strong>Annual</strong> <strong>Report</strong> <strong>2010</strong>