Issue of Annual Report 2010
Issue of Annual Report 2010
Issue of Annual Report 2010

Create successful ePaper yourself
Turn your PDF publications into a flip-book with our unique Google optimized e-Paper software.
Sapporo Group Management Plan 2011–2012<br />
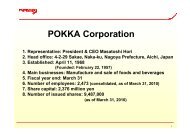
Group Portfolio at a Glance<br />
■ International Alcoholic Beverages ■ POKKA ■ Japanese Alcoholic Beverages ■ Real Estate ■ S<strong>of</strong>t Drinks ■ Restaurants<br />
<strong>2010</strong> 2012 Target<br />
Group Synergies<br />
Growth Drivers<br />
6%<br />
7% 7%<br />
9%<br />
¥389.2<br />
Net Sales (¥ billion)<br />
5% 6%<br />
8%<br />
5%<br />
¥519.5<br />
Target<br />
20%<br />
72%<br />
■ ¥25.4 ➔ ¥32.2<br />
■ – ➔ ¥103.9<br />
■ ¥279.3 ➔ ¥290.6<br />
■ ¥23.5 ➔ ¥24.7<br />
■ ¥33.9 ➔ ¥39.8<br />
■ ¥26.4 ➔ ¥26.3<br />
56%<br />
*The result <strong>of</strong> ¥0.6 billion → ¥2.0 billion for Other<br />
has been omitted from the pie charts.<br />
Earnings Stabilities<br />
1%<br />
7% 3%<br />
1%<br />
3%3% 10%<br />
42%<br />
¥15.4 48%<br />
Operating Income (¥ billion)<br />
■ ¥0.5 ➔ ¥0.3<br />
■ – ➔ ¥2.4<br />
■ ¥9.2 ➔ ¥10.6<br />
■ ¥8.0 ➔ ¥9.0<br />
■ ¥1.3 ➔ ¥0.7<br />
■ ¥0.2 ➔ ¥0.6<br />
38%<br />
¥20.0<br />
Target<br />
45%<br />
*Results <strong>of</strong> –¥0.7 billion → –¥0.3 billion for Other and<br />
–¥3.0 billion → –¥3.3 billion for general corporate<br />
and intercompany eliminations have been omitted<br />
from the pie charts.<br />
Note: All figures in this annual report are rounded to the nearest applicable unit.<br />
All Management Plan figures are derived from a simplified segment classification method based on the management approach.