Issue of Annual Report 2010
Issue of Annual Report 2010
Issue of Annual Report 2010

You also want an ePaper? Increase the reach of your titles
YUMPU automatically turns print PDFs into web optimized ePapers that Google loves.
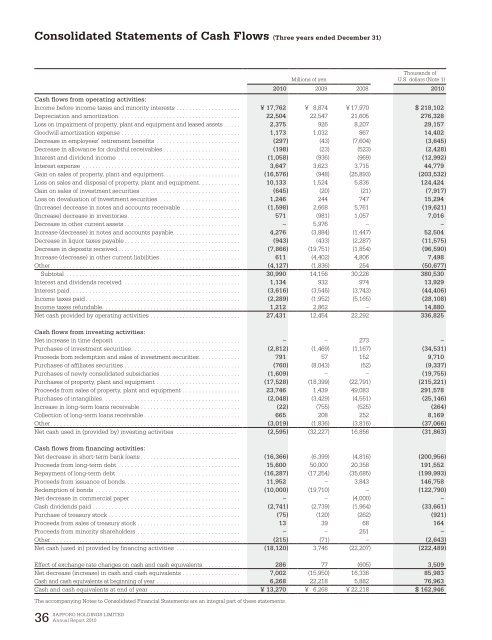
Consolidated Statements <strong>of</strong> Cash Flows (Three years ended December 31)<br />
SAPPORO HOLDINGS LIMITED<br />
36 <strong>Annual</strong> <strong>Report</strong> <strong>2010</strong><br />
Millions <strong>of</strong> yen<br />
Thousands <strong>of</strong><br />
U.S. dollars (Note 1)<br />
<strong>2010</strong> 2009 2008 <strong>2010</strong><br />
Cash flows from operating activities:<br />
Income before income taxes and minority interests . . . . . . . . . . . . . . . . . . . . ¥17,762 ¥ 8,874 ¥ 17,970 $ 218,102<br />
Depreciation and amortization. . . . . . . . . . . . . . . . . . . . . . . . . . . . . . . . . . . . . . 22,504 22,547 21,605 276,328<br />
Loss on impairment <strong>of</strong> property, plant and equipment and leased assets . . . . . 2,375 926 8,207 29,157<br />
Goodwill amortization expense . . . . . . . . . . . . . . . . . . . . . . . . . . . . . . . . . . . . . 1,173 1,032 867 14,402<br />
Decrease in employees’ retirement benefits . . . . . . . . . . . . . . . . . . . . . . . . . . (297) (43) (7,604) (3,645)<br />
Decrease in allowance for doubtful receivables . . . . . . . . . . . . . . . . . . . . . . . . (198) (23) (523) (2,428)<br />
Interest and dividend income . . . . . . . . . . . . . . . . . . . . . . . . . . . . . . . . . . . . . . (1,058) (936) (969) (12,992)<br />
Interest expense . . . . . . . . . . . . . . . . . . . . . . . . . . . . . . . . . . . . . . . . . . . . . . . . . 3,647 3,623 3,715 44,779<br />
Gain on sales <strong>of</strong> property, plant and equipment . . . . . . . . . . . . . . . . . . . . . . . . (16,576) (948) (25,893) (203,532)<br />
Loss on sales and disposal <strong>of</strong> property, plant and equipment . . . . . . . . . . . . . 10,133 1,524 5,836 124,424<br />
Gain on sales <strong>of</strong> investment securities . . . . . . . . . . . . . . . . . . . . . . . . . . . . . . . (645) (20) (21) (7,917)<br />
Loss on devaluation <strong>of</strong> investment securities . . . . . . . . . . . . . . . . . . . . . . . . . 1,246 244 747 15,294<br />
(Increase) decrease in notes and accounts receivable . . . . . . . . . . . . . . . . . . (1,598) 2,668 5,761 (19,621)<br />
(Increase) decrease in inventories . . . . . . . . . . . . . . . . . . . . . . . . . . . . . . . . . . . 571 (981) 1,057 7,016<br />
Decrease in other current assets . . . . . . . . . . . . . . . . . . . . . . . . . . . . . . . . . . . . – 5,976 – –<br />
Increase (decrease) in notes and accounts payable. . . . . . . . . . . . . . . . . . . . . 4,276 (3,884) (1,447) 52,504<br />
Decrease in liquor taxes payable . . . . . . . . . . . . . . . . . . . . . . . . . . . . . . . . . . . . (943) (433) (2,287) (11,575)<br />
Decrease in deposits received . . . . . . . . . . . . . . . . . . . . . . . . . . . . . . . . . . . . . . (7,866) (19,751) (1,854) (96,590)<br />
Increase (decrease) in other current liabilities . . . . . . . . . . . . . . . . . . . . . . . . . 611 (4,402) 4,806 7,498<br />
Other . . . . . . . . . . . . . . . . . . . . . . . . . . . . . . . . . . . . . . . . . . . . . . . . . . . . . . . . . . . (4,127) (1,836) 254 (50,677)<br />
Subtotal . . . . . . . . . . . . . . . . . . . . . . . . . . . . . . . . . . . . . . . . . . . . . . . . . . . . . . 30,990 14,156 30,226 380,530<br />
Interest and dividends received . . . . . . . . . . . . . . . . . . . . . . . . . . . . . . . . . . . . 1,134 932 974 13,929<br />
Interest paid . . . . . . . . . . . . . . . . . . . . . . . . . . . . . . . . . . . . . . . . . . . . . . . . . . . . . (3,616) (3,545) (3,743) (44,406)<br />
Income taxes paid . . . . . . . . . . . . . . . . . . . . . . . . . . . . . . . . . . . . . . . . . . . . . . . . (2,289) (1,952) (5,165) (28,108)<br />
Income taxes refundable. . . . . . . . . . . . . . . . . . . . . . . . . . . . . . . . . . . . . . . . . . . 1,212 2,862 – 14,880<br />
Net cash provided by operating activities . . . . . . . . . . . . . . . . . . . . . . . . . . . . 27,431 12,454 22,292 336,825<br />
Cash flows from investing activities:<br />
Net increase in time deposit . . . . . . . . . . . . . . . . . . . . . . . . . . . . . . . . . . . . . . . – – 273 –<br />
Purchases <strong>of</strong> investment securities . . . . . . . . . . . . . . . . . . . . . . . . . . . . . . . . . . (2,812) (1,469) (1,167) (34,531)<br />
Proceeds from redemption and sales <strong>of</strong> investment securities . . . . . . . . . . . . . 791 57 152 9,710<br />
Purchases <strong>of</strong> affiliates securities . . . . . . . . . . . . . . . . . . . . . . . . . . . . . . . . . . . . (760) (8,043) (52) (9,337)<br />
Purchases <strong>of</strong> newly consolidated subsidiaries . . . . . . . . . . . . . . . . . . . . . . . . . (1,609) – – (19,755)<br />
Purchases <strong>of</strong> property, plant and equipment . . . . . . . . . . . . . . . . . . . . . . . . . . (17,528) (18,399) (22,791) (215,221)<br />
Proceeds from sales <strong>of</strong> property, plant and equipment . . . . . . . . . . . . . . . . . . 23,746 1,439 49,083 291,578<br />
Purchases <strong>of</strong> intangibles . . . . . . . . . . . . . . . . . . . . . . . . . . . . . . . . . . . . . . . . . . . (2,048) (3,429) (4,551) (25,146)<br />
Increase in long-term loans receivable . . . . . . . . . . . . . . . . . . . . . . . . . . . . . . . (22) (755) (525) (264)<br />
Collection <strong>of</strong> long-term loans receivable . . . . . . . . . . . . . . . . . . . . . . . . . . . . . . 665 208 252 8,169<br />
Other . . . . . . . . . . . . . . . . . . . . . . . . . . . . . . . . . . . . . . . . . . . . . . . . . . . . . . . . . . . (3,019) (1,836) (3,816) (37,066)<br />
Net cash used in (provided by) investing activities . . . . . . . . . . . . . . . . . . . (2,595) (32,227) 16,856 (31,863)<br />
Cash flows from financing activities:<br />
Net decrease in short-term bank loans . . . . . . . . . . . . . . . . . . . . . . . . . . . . . . . (16,366) (6,399) (4,816) (200,956)<br />
Proceeds from long-term debt . . . . . . . . . . . . . . . . . . . . . . . . . . . . . . . . . . . . . . 15,600 50,000 20,358 191,552<br />
Repayment <strong>of</strong> long-term debt . . . . . . . . . . . . . . . . . . . . . . . . . . . . . . . . . . . . . . (16,287) (17,254) (35,685) (199,993)<br />
Proceeds from issuance <strong>of</strong> bonds. . . . . . . . . . . . . . . . . . . . . . . . . . . . . . . . . . . . 11,952 – 3,843 146,758<br />
Redemption <strong>of</strong> bonds . . . . . . . . . . . . . . . . . . . . . . . . . . . . . . . . . . . . . . . . . . . . . (10,000) (19,710) – (122,790)<br />
Net decrease in commercial paper . . . . . . . . . . . . . . . . . . . . . . . . . . . . . . . . . . – – (4,000) –<br />
Cash dividends paid . . . . . . . . . . . . . . . . . . . . . . . . . . . . . . . . . . . . . . . . . . . . . . (2,741) (2,739) (1,964) (33,661)<br />
Purchase <strong>of</strong> treasury stock . . . . . . . . . . . . . . . . . . . . . . . . . . . . . . . . . . . . . . . . . (75) (120) (262) (921)<br />
Proceeds from sales <strong>of</strong> treasury stock . . . . . . . . . . . . . . . . . . . . . . . . . . . . . . . . 13 39 68 164<br />
Proceeds from minority shareholders . . . . . . . . . . . . . . . . . . . . . . . . . . . . . . . . – – 251 –<br />
Other . . . . . . . . . . . . . . . . . . . . . . . . . . . . . . . . . . . . . . . . . . . . . . . . . . . . . . . . . . . (215) (71) – (2,643)<br />
Net cash (used in) provided by financing activities . . . . . . . . . . . . . . . . . . . . (18,120) 3,746 (22,207) (222,489)<br />
Effect <strong>of</strong> exchange rate changes on cash and cash equivalents . . . . . . . . . . . . 286 77 (605) 3,509<br />
Net decrease (increase) in cash and cash equivalents . . . . . . . . . . . . . . . . . . 7,002 (15,950) 16,336 85,983<br />
Cash and cash equivalents at beginning <strong>of</strong> year . . . . . . . . . . . . . . . . . . . . . . . . . . 6,268 22,218 5,882 76,963<br />
Cash and cash equivalents at end <strong>of</strong> year . . . . . . . . . . . . . . . . . . . . . . . . . . . . ¥13,270 ¥ 6,268 ¥ 22,218 $ 162,946<br />
The accompanying Notes to Consolidated Financial Statements are an integral part <strong>of</strong> these statements.