Issue of Annual Report 2010
Issue of Annual Report 2010
Issue of Annual Report 2010

Create successful ePaper yourself
Turn your PDF publications into a flip-book with our unique Google optimized e-Paper software.
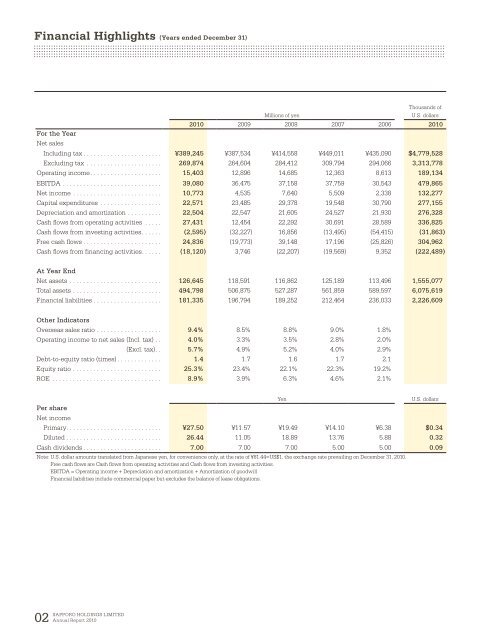
Financial Highlights (Years ended December 31)<br />
Thousands <strong>of</strong><br />
Millions <strong>of</strong> yen<br />
U.S. dollars<br />
<strong>2010</strong> 2009 2008 2007 2006 <strong>2010</strong><br />
For the Year<br />
Net sales<br />
Including tax . . . . . . . . . . . . . . . . . . . . . . . ¥389,245 ¥387,534 ¥414,558 ¥449,011 ¥435,090 $4,779,528<br />
Excluding tax . . . . . . . . . . . . . . . . . . . . . . 269,874 264,604 284,412 309,794 294,066 3,313,778<br />
Operating income . . . . . . . . . . . . . . . . . . . . . 15,403 12,896 14,685 12,363 8,613 189,134<br />
EBITDA . . . . . . . . . . . . . . . . . . . . . . . . . . . . . 39,080 36,475 37,158 37,759 30,543 479,865<br />
Net income . . . . . . . . . . . . . . . . . . . . . . . . . . 10,773 4,535 7,640 5,509 2,338 132,277<br />
Capital expenditures . . . . . . . . . . . . . . . . . . 22,571 23,485 29,378 19,548 30,790 277,155<br />
Depreciation and amortization . . . . . . . . . . 22,504 22,547 21,605 24,527 21,930 276,328<br />
Cash flows from operating activities . . . . . 27,431 12,454 22,292 30,691 28,589 336,825<br />
Cash flows from investing activities . . . . . . (2,595) (32,227) 16,856 (13,495) (54,415) (31,863)<br />
Free cash flows . . . . . . . . . . . . . . . . . . . . . . . 24,836 (19,773) 39,148 17,196 (25,826) 304,962<br />
Cash flows from financing activities. . . . . . (18,120) 3,746 (22,207) (19,569) 9,352 (222,489)<br />
At Year End<br />
Net assets . . . . . . . . . . . . . . . . . . . . . . . . . . . 126,645 118,591 116,862 125,189 113,496 1,555,077<br />
Total assets . . . . . . . . . . . . . . . . . . . . . . . . . . 494,798 506,875 527,287 561,859 589,597 6,075,619<br />
Financial liabilities . . . . . . . . . . . . . . . . . . . . 181,335 196,794 189,252 212,464 236,033 2,226,609<br />
Other Indicators<br />
Overseas sales ratio . . . . . . . . . . . . . . . . . . . 9.4% 8.5% 8.8% 9.0% 1.8%<br />
Operating income to net sales (Incl. tax) . . 4.0% 3.3% 3.5% 2.8% 2.0%<br />
(Excl. tax) . . 5.7% 4.9% 5.2% 4.0% 2.9%<br />
Debt-to-equity ratio (times) . . . . . . . . . . . . . 1.4 1.7 1.6 1.7 2.1<br />
Equity ratio . . . . . . . . . . . . . . . . . . . . . . . . . . 25.3% 23.4% 22.1% 22.3% 19.2%<br />
ROE . . . . . . . . . . . . . . . . . . . . . . . . . . . . . . . . 8.9% 3.9% 6.3% 4.6% 2.1%<br />
Yen<br />
U.S. dollars<br />
Per share<br />
Net income<br />
Primary . . . . . . . . . . . . . . . . . . . . . . . . . . . . ¥27.50 ¥11.57 ¥19.49 ¥14.10 ¥6.38 $0.34<br />
Diluted . . . . . . . . . . . . . . . . . . . . . . . . . . . . 26.44 11.05 18.89 13.76 5.88 0.32<br />
Cash dividends . . . . . . . . . . . . . . . . . . . . . . . 7.00 7.00 7.00 5.00 5.00 0.09<br />
Note: U.S. dollar amounts translated from Japanese yen, for convenience only, at the rate <strong>of</strong> ¥81.44=US$1, the exchange rate prevailing on December 31, <strong>2010</strong>.<br />
Free cash flows are Cash flows from operating activities and Cash flows from investing activities.<br />
EBITDA = Operating income + Depreciation and amortization + Amortization <strong>of</strong> goodwill<br />
Financial liabilities include commercial paper but excludes the balance <strong>of</strong> lease obligations.<br />
02<br />
SAPPORO HOLDINGS LIMITED<br />
<strong>Annual</strong> <strong>Report</strong> <strong>2010</strong>