CAFR - sdcera
CAFR - sdcera
CAFR - sdcera

You also want an ePaper? Increase the reach of your titles
YUMPU automatically turns print PDFs into web optimized ePapers that Google loves.
F I N A N C I A L / M A N A G E M E N T ’ S D I S C U S S I O N A N D A N A L Y S I S<br />
Both statements are in compliance with Government Accounting Standards Board (GASB)<br />
Statements Nos. 25, 28, 34, 37, 38, 40, and 43. These pronouncements require certain disclosures<br />
and also require state and local governments to report using the full accrual method of<br />
accounting. SDCERA complies with all requirements of these pronouncements, as applicable.<br />
The Notes to the Basic Financial Statements are an integral part of the basic financial statements.<br />
They provide important background and detailed information that are essential to a full understanding<br />
of the data provided in the financial statements.<br />
The Required Supplementary Information contains information and supporting schedules pertaining<br />
to SDCERA’s actuarial methods and assumptions including data on the funded status of the plan.<br />
Supporting schedules are administrative expenses (presenting the overall cost of administering<br />
the fund) and investment expenses (costs associated with investing the assets of the fund).<br />
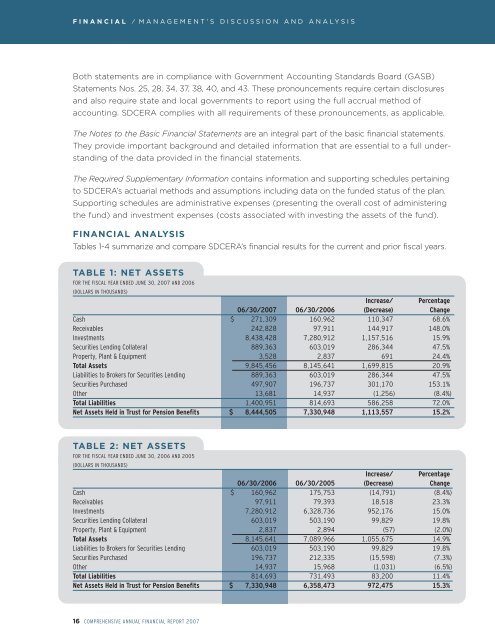
FINANCIAL ANALYSIS<br />
Tables 1-4 summarize and compare SDCERA’s financial results for the current and prior fiscal years.<br />
TABLE 1: NET ASSETS<br />
FOR THE FISCAL YEAR ENDED JUNE 30, 2007 AND 2006<br />
(DOLLARS IN THOUSANDS)<br />
Increase/ Percentage<br />
06/30/2007 06/30/2006 (Decrease) Change<br />
Cash $ 271,309 160,962 110,347 68.6%<br />
Receivables 242,828 97,911 144,917 148.0%<br />
Investments 8,438,428 7,280,912 1,157,516 15.9%<br />
Securities Lending Collateral 889,363 603,019 286,344 47.5%<br />
Property, Plant & Equipment 3,528 2,837 691 24.4%<br />
Total Assets 9,845,456 8,145,641 1,699,815 20.9%<br />
Liabilities to Brokers for Securities Lending 889,363 603,019 286,344 47.5%<br />
Securities Purchased 497,907 196,737 301,170 153.1%<br />
Other 13,681 14,937 (1,256) (8.4%)<br />
Total Liabilities 1,400,951 814,693 586,258 72.0%<br />
Net Assets Held in Trust for Pension Benefits $ 8,444,505 7,330,948 1,113,557 15.2%<br />
TABLE 2: NET ASSETS<br />
FOR THE FISCAL YEAR ENDED JUNE 30, 2006 AND 2005<br />
(DOLLARS IN THOUSANDS)<br />
Increase/ Percentage<br />
06/30/2006 06/30/2005 (Decrease) Change<br />
Cash $ 160,962 175,753 (14,791) (8.4%)<br />
Receivables 97,911 79,393 18,518 23.3%<br />
Investments 7,280,912 6,328,736 952,176 15.0%<br />
Securities Lending Collateral 603,019 503,190 99,829 19.8%<br />
Property, Plant & Equipment 2,837 2,894 (57) (2.0%)<br />
Total Assets 8,145,641 7,089,966 1,055,675 14.9%<br />
Liabilities to Brokers for Securities Lending 603,019 503,190 99,829 19.8%<br />
Securities Purchased 196,737 212,335 (15,598) (7.3%)<br />
Other 14,937 15,968 (1,031) (6.5%)<br />
Total Liabilities 814,693 731,493 83,200 11.4%<br />
Net Assets Held in Trust for Pension Benefits $ 7,330,948 6,358,473 972,475 15.3%<br />
16 COMPREHENSIVE ANNUAL FINANCIAL REPORT 2007