CAFR - sdcera
CAFR - sdcera
CAFR - sdcera

Create successful ePaper yourself
Turn your PDF publications into a flip-book with our unique Google optimized e-Paper software.
H I S T O R I C M E M B E R S H I P D A T A / A C T U A R I A L<br />
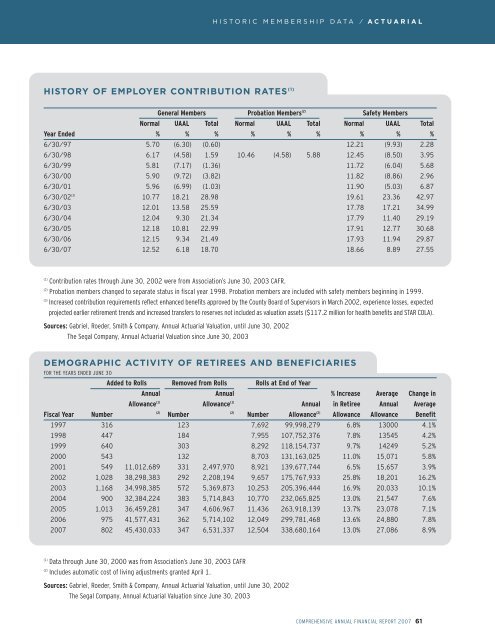
HISTORY OF EMPLOYER CONTRIBUTION RATES (1)<br />
General Members Probation Members (2) Safety Members<br />
Normal UAAL Total Normal UAAL Total Normal UAAL Total<br />
Year Ended % % % % % % % % %<br />
6/30/97 5.70 (6.30) (0.60) 12.21 (9.93) 2.28<br />
6/30/98 6.17 (4.58) 1.59 10.46 (4.58) 5.88 12.45 (8.50) 3.95<br />
6/30/99 5.81 (7.17) (1.36) 11.72 (6.04) 5.68<br />
6/30/00 5.90 (9.72) (3.82) 11.82 (8.86) 2.96<br />
6/30/01 5.96 (6.99) (1.03) 11.90 (5.03) 6.87<br />
6/30/02 (3) 10.77 18.21 28.98 19.61 23.36 42.97<br />
6/30/03 12.01 13.58 25.59 17.78 17.21 34.99<br />
6/30/04 12.04 9.30 21.34 17.79 11.40 29.19<br />
6/30/05 12.18 10.81 22.99 17.91 12.77 30.68<br />
6/30/06 12.15 9.34 21.49 17.93 11.94 29.87<br />
6/30/07 12.52 6.18 18.70 18.66 8.89 27.55<br />
(1)<br />
Contribution rates through June 30, 2002 were from Association’s June 30, 2003 <strong>CAFR</strong>.<br />
(2)<br />
Probation members changed to separate status in fiscal year 1998. Probation members are included with safety members beginning in 1999.<br />
(3)<br />
Increased contribution requirements reflect enhanced benefits approved by the County Board of Supervisors in March 2002, experience losses, expected<br />
projected earlier retirement trends and increased transfers to reserves not included as valuation assets ($117.2 million for health benefits and STAR COLA).<br />
Sources: Gabriel, Roeder, Smith & Company, Annual Actuarial Valuation, until June 30, 2002<br />
The Segal Company, Annual Actuarial Valuation since June 30, 2003<br />
DEMOGRAPHIC ACTIVITY OF RETIREES AND BENEFICIARIES<br />
FOR THE YEARS ENDED JUNE 30<br />
Added to Rolls Removed from Rolls Rolls at End of Year<br />
Annual Annual % Increase Average Change in<br />
Allowance (1) Allowance (1) Annual in Retiree Annual Average<br />
Fiscal Year Number<br />
(2)<br />
Number<br />
(2)<br />
Number Allowance (2) Allowance Allowance Benefit<br />
1997 316 123 7,692 99,998,279 6.8% 13000 4.1%<br />
1998 447 184 7,955 107,752,376 7.8% 13545 4.2%<br />
1999 640 303 8,292 118,154,737 9.7% 14249 5.2%<br />
2000 543 132 8,703 131,163,025 11.0% 15,071 5.8%<br />
2001 549 11,012,689 331 2,497,970 8,921 139,677,744 6.5% 15,657 3.9%<br />
2002 1,028 38,298,383 292 2,208,194 9,657 175,767,933 25.8% 18,201 16.2%<br />
2003 1,168 34,998,385 572 5,369,873 10,253 205,396,444 16.9% 20,033 10.1%<br />
2004 900 32,384,224 383 5,714,843 10,770 232,065,825 13.0% 21,547 7.6%<br />
2005 1,013 36,459,281 347 4,606,967 11,436 263,918,139 13.7% 23,078 7.1%<br />
2006 975 41,577,431 362 5,714,102 12,049 299,781,468 13.6% 24,880 7.8%<br />
2007 802 45,430,033 347 6,531,337 12,504 338,680,164 13.0% 27,086 8.9%<br />
(1)<br />
Data through June 30, 2000 was from Association’s June 30, 2003 <strong>CAFR</strong><br />
(2)<br />
Includes automatic cost of living adjustments granted April 1.<br />
Sources: Gabriel, Roeder, Smith & Company, Annual Actuarial Valuation, until June 30, 2002<br />
The Segal Company, Annual Actuarial Valuation since June 30, 2003<br />
COMPREHENSIVE ANNUAL FINANCIAL REPORT 2007 61