CAFR - sdcera
CAFR - sdcera
CAFR - sdcera

You also want an ePaper? Increase the reach of your titles
YUMPU automatically turns print PDFs into web optimized ePapers that Google loves.
F I N A N C I A L / M A N A G E M E N T ’ S D I S C U S S I O N A N D A N A L Y S I S<br />
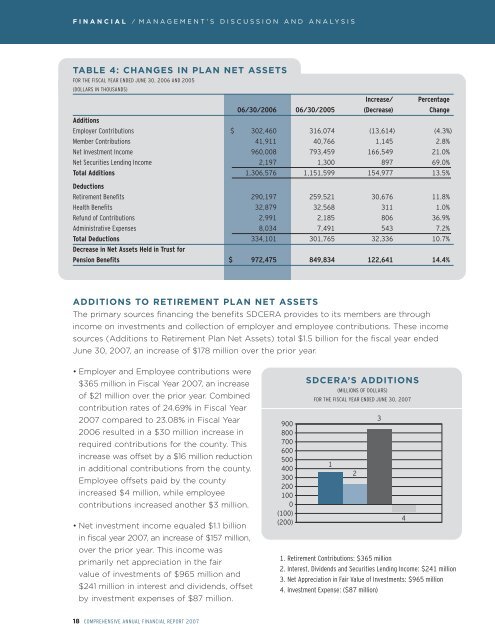
TABLE 4: CHANGES IN PLAN NET ASSETS<br />
FOR THE FISCAL YEAR ENDED JUNE 30, 2006 AND 2005<br />
(DOLLARS IN THOUSANDS)<br />
Increase/ Percentage<br />
06/30/2006 06/30/2005 (Decrease) Change<br />
Additions<br />
Employer Contributions $ 302,460 316,074 (13,614) (4.3%)<br />
Member Contributions 41,911 40,766 1,145 2.8%<br />
Net Investment Income 960,008 793,459 166,549 21.0%<br />
Net Securities Lending Income 2,197 1,300 897 69.0%<br />
Total Additions 1,306,576 1,151,599 154,977 13.5%<br />
Deductions<br />
Retirement Benefits 290,197 259,521 30,676 11.8%<br />
Health Benefits 32,879 32,568 311 1.0%<br />
Refund of Contributions 2,991 2,185 806 36.9%<br />
Administrative Expenses 8,034 7,491 543 7.2%<br />
Total Deductions 9.0<br />
334,101 301,765 32,336 10.7%<br />
Decrease in Net Assets Held in 8.0 Trust for<br />
Pension Benefits 7.0<br />
$ 972,475 849,834 25.00% 122,641 14.4%<br />
6.0<br />
20.00%<br />
5.0<br />
15.00%<br />
4.0<br />
10.00%<br />
ADDITIONS TO RETIREMENT 3.0<br />
PLAN NET ASSETS<br />
5.00%<br />
The primary sources financing<br />
2.0<br />
the benefits SDCERA provides to its members<br />
0.00%<br />
are through<br />
1.0<br />
-5.00%<br />
income on investments and collection of employer and employee contributions. These income<br />
0.0<br />
-10.00%<br />
sources (Additions to Retirement Plan Net Assets) total $1.5 billion for the fiscal year ended<br />
June 30, 2007, an increase of $178 million over the prior year.<br />
Net Assets<br />
• Employer and Employee contributions were<br />
Investment Returns<br />
$365 million in Fiscal Year 2007, an increase<br />
of $21 million over the prior year. Combined<br />
SDCERA’S ADDITIONS<br />
(MILLIONS OF DOLLARS)<br />
FOR THE FISCAL YEAR ENDED JUNE 30, 2007<br />
contribution rates of 24.69% in Fiscal Year<br />
2007 compared to 23.08% in Fiscal Year<br />
2006 resulted in a $30 million increase in<br />
900<br />
800<br />
3<br />
required contributions for the county. This<br />
700<br />
600<br />
increase was offset by a $16 million reduction 500<br />
1<br />
in additional contributions from the county. 400<br />
2<br />
Employee offsets paid by the county<br />
300<br />
200<br />
increased $4 million, while employee<br />
100<br />
contributions increased another $3 million.<br />
0<br />
1998<br />
1999<br />
2000<br />
2001<br />
2002<br />
• Net investment income equaled $1.1 billion<br />
in fiscal year 2007, an increase of $157 million,<br />
over the prior year. This income was<br />
primarily net appreciation in the fair<br />
value of investments of $965 million and<br />
$241 million in interest and dividends, offset<br />
by investment expenses of $87 million.<br />
2003<br />
2004<br />
2005<br />
2006<br />
2007<br />
(100)<br />
(200)<br />
1. Retirement Contributions: $365 million<br />
2. Interest, Dividends and Securities Lending Income: $241 million<br />
3. Net Appreciation in Fair Value of Investments: $965 million<br />
4. Investment Expense: ($87 million)<br />
350<br />
4<br />
2<br />
1998<br />
1999<br />
2000<br />
2001<br />
2002<br />
2003<br />
2004<br />
18 COMPREHENSIVE ANNUAL FINANCIAL REPORT 2007<br />
300<br />
250