CAFR - sdcera
CAFR - sdcera
CAFR - sdcera

You also want an ePaper? Increase the reach of your titles
YUMPU automatically turns print PDFs into web optimized ePapers that Google loves.
A C T U A R I A L /<br />
C O S T M E T H O D S & A S S U M P T I O N S<br />
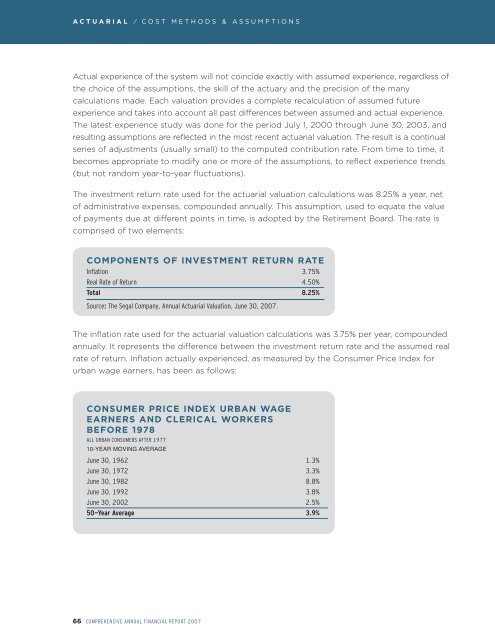
Actual experience of the system will not coincide exactly with assumed experience, regardless of<br />
the choice of the assumptions, the skill of the actuary and the precision of the many<br />
calculations made. Each valuation provides a complete recalculation of assumed future<br />
experience and takes into account all past differences between assumed and actual experience.<br />
The latest experience study was done for the period July 1, 2000 through June 30, 2003, and<br />
resulting assumptions are reflected in the most recent actuarial valuation. The result is a continual<br />
series of adjustments (usually small) to the computed contribution rate. From time to time, it<br />
becomes appropriate to modify one or more of the assumptions, to reflect experience trends<br />
(but not random year-to-year fluctuations).<br />
The investment return rate used for the actuarial valuation calculations was 8.25% a year, net<br />
of administrative expenses, compounded annually. This assumption, used to equate the value<br />
of payments due at different points in time, is adopted by the Retirement Board. The rate is<br />
comprised of two elements:<br />
COMPONENTS OF INVESTMENT RETURN RATE<br />
Inflation 3.75%<br />
Real Rate of Return 4.50%<br />
Total 8.25%<br />
Source: The Segal Company, Annual Actuarial Valuation, June 30, 2007.<br />
The inflation rate used for the actuarial valuation calculations was 3.75% per year, compounded<br />
annually. It represents the difference between the investment return rate and the assumed real<br />
rate of return. Inflation actually experienced, as measured by the Consumer Price Index for<br />
urban wage earners, has been as follows:<br />
CONSUMER PRICE INDEX URBAN WAGE<br />
EARNERS AND CLERICAL WORKERS<br />
BEFORE 1978<br />
ALL URBAN CONSUMERS AFTER 1977<br />
10-YEAR MOVING AVERAGE<br />
June 30, 1962 1.3%<br />
June 30, 1972 3.3%<br />
June 30, 1982 8.8%<br />
June 30, 1992 3.8%<br />
June 30, 2002 2.5%<br />
50-Year Average 3.9%<br />
66 COMPREHENSIVE ANNUAL FINANCIAL REPORT 2007