EXPLAINING SOCIAL EXCLUSION - Institut für Soziologie
EXPLAINING SOCIAL EXCLUSION - Institut für Soziologie
EXPLAINING SOCIAL EXCLUSION - Institut für Soziologie

You also want an ePaper? Increase the reach of your titles
YUMPU automatically turns print PDFs into web optimized ePapers that Google loves.
International Journal of Sociology and Social Policy 102<br />
on the causes of transitions. There are some life-course sociologists<br />
who claim that trajectories are not adequately treated by this kind of<br />
methodology (Abbott and Hrycak 1990). Knowing a lot about transitions<br />
without knowing much about trajectories is like seeing the trees<br />
but not the wood.<br />
Using optimal matching analysis we want to see whether there<br />
are types of careers that show a pattern of exclusion. The focus of this<br />
method is not on single transitions but on whole occupational sequences<br />
and their comparison. For example three sequences of different<br />
persons could look like this: CCUD; CUUD; CCCC, where C<br />
indicates the state "constant Status employment position", U refers to<br />
"unemployed" and D indicates "downward mobility". As each letter is<br />
a measurement of one month the sequence CCCC is an equivalent to<br />
four months in a constant employment position. Optimal matching refers<br />
to a distance measure that is calculated by a comparison of each<br />
sequence with any other. In our example a visual inspection shows that<br />
the sequence CCUD is more similar to the sequence CUUD than to the<br />
sequence CCCC; and CCCC is more similar to CCUD than to CUUD.<br />
With large data sets and long sequences visual inspection is not possible.<br />
Optimal matching computes a matrix of similarity values between<br />
each sequence of the data set. In a second step these distances can be<br />
used in cluster analysis in order to find groups with similar employment<br />
sequences.<br />
In our analysis, states of employment were differentiated into<br />
the following categories: constant Status positions; small downward<br />
mobility positions with a 5-10% lower occupational prestige than the<br />
certificate; large downward mobility positions with a more than 10%<br />
lower occupational prestige, and likewise defined small and large upward<br />
mobility positions. Mobility was measured by comparing the<br />
time-specific prestige score (Ganzeboom and Treiman 1996) with the<br />
prestige score of qualification (according to occupation-specific<br />
graduation or apprenticeship certificate). "Constant Status position"<br />
refers to equivalent values of these two prestige scores. Three states of<br />
non-employment were included: unemployment, studying, and other<br />
kinds of non-employment, which mainly consist of spells of retraining<br />
Volume 21 Number 4/5/6 2001 103<br />
or housewife positions. Similarity distances won by optimal matching<br />
algorithms were clustered afterwards with the Ward algorithm. A four<br />
cluster solution was chosen, which showed distinct patterns of career.<br />
Within these four clusters two favourable and two unfavourable<br />
or ambivalent clusters can be seen. The favourable clusters were called<br />
"in constant position" and "the big winners". The unfavourable and the<br />
ambivalent clusters were labelled "the big loss" and "the risky decisions".<br />
The figures two to five show the aggregate time dependent distributions<br />
of our eight states within each cluster.<br />
100%<br />
80%<br />
60%<br />
40%<br />
20%<br />
0%<br />
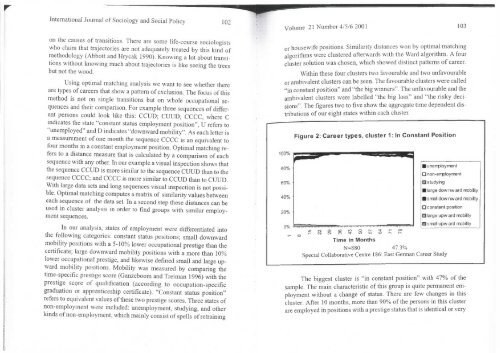
Figure 2: Career types, cluster 1: In Constant Position<br />
• unemployment<br />
D non-employment<br />
ü studying<br />
• large dow nw ard mobility<br />
• small dow nw ard mobility<br />
D constant position<br />
M large upw ard mobility<br />
D small upw ard mobility<br />
Time in Months<br />
N=880 47.3%<br />
Special Collaborative Centre 186: East German Career Study<br />
The biggest cluster is "in constant position" with 47% of the<br />
sample. The main characteristic of this group is quite permanent employment<br />
without a change of Status. There are few changes in this<br />
cluster: After 10 months, more than 90% of the persons in this cluster<br />
are employed in positions with a prestige Status that is identical or very