

pdf - SRON
pdf - SRON
pdf - SRON

Create successful ePaper yourself
Turn your PDF publications into a flip-book with our unique Google optimized e-Paper software.
CHAPTER 3: SOURCE COUNTS OF THE AXIS SOURCES<br />
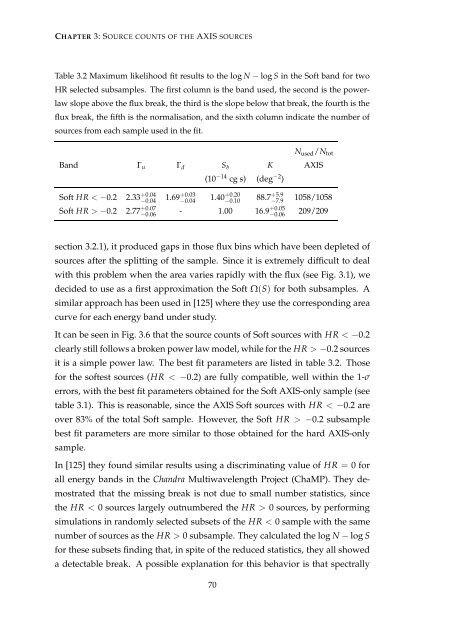
Table 3.2 Maximum likelihood fit results to the log N − log S in the Soft band for two<br />
HR selected subsamples. The first column is the band used, the second is the powerlaw<br />
slope above the flux break, the third is the slope below that break, the fourth is the<br />
flux break, the fifth is the normalisation, and the sixth column indicate the number of<br />
sources from each sample used in the fit.<br />
N used /N tot<br />
Band Γ u Γ d S b K AXIS<br />
(10 −14 cg s) (deg −2 )<br />
Soft HR < −0.2 2.33 +0.04<br />
−0.04<br />
1.69 +0.03<br />
−0.04<br />
1.40 +0.20<br />
−0.10<br />
88.7 +5.9<br />
−7.9<br />
1058/1058<br />
Soft HR > −0.2 2.77 +0.07<br />
−0.06<br />
- 1.00 16.9 +0.05<br />
−0.06<br />
209/209<br />
section 3.2.1), it produced gaps in those flux bins which have been depleted of<br />
sources after the splitting of the sample. Since it is extremely difficult to deal<br />
with this problem when the area varies rapidly with the flux (see Fig. 3.1), we<br />
decided to use as a first approximation the Soft Ω(S) for both subsamples. A<br />
similar approach has been used in [125] where they use the corresponding area<br />
curve for each energy band under study.<br />
It can be seen in Fig. 3.6 that the source counts of Soft sources with HR < −0.2<br />
clearly still follows a broken power law model, while for the HR > −0.2 sources<br />
it is a simple power law. The best fit parameters are listed in table 3.2. Those<br />
for the softest sources (HR < −0.2) are fully compatible, well within the 1-σ<br />
errors, with the best fit parameters obtained for the Soft AXIS-only sample (see<br />
table 3.1). This is reasonable, since the AXIS Soft sources with HR < −0.2 are<br />
over 83% of the total Soft sample. However, the Soft HR > −0.2 subsample<br />
best fit parameters are more similar to those obtained for the hard AXIS-only<br />
sample.<br />
In [125] they found similar results using a discriminating value of HR = 0 for<br />
all energy bands in the Chandra Multiwavelength Project (ChaMP). They demostrated<br />
that the missing break is not due to small number statistics, since<br />
the HR < 0 sources largely outnumbered the HR > 0 sources, by performing<br />
simulations in randomly selected subsets of the HR < 0 sample with the same<br />
number of sources as the HR > 0 subsample. They calculated the log N − log S<br />
for these subsets finding that, in spite of the reduced statistics, they all showed<br />
a detectable break. A possible explanation for this behavior is that spectrally<br />
70


