- Page 3:
Universidad de Cantabria Departamen
- Page 7:
A mis padres
- Page 10 and 11:
explicar las altas luminosidades de
- Page 12 and 13:
Además, una importante fracción (
- Page 14 and 15:
ealizar estudios de espectroscopía
- Page 16 and 17:
distribución diferencial que, al e
- Page 18 and 19:
materia sobre el agujero negro cent
- Page 20 and 21:
analizadas proviene de fuentes en t
- Page 22:
Haciendo uso del segundo catálogo
- Page 27:
With magic, you can turn a frog int
- Page 30:
Un capítulo aparte merecen mis com
- Page 33 and 34:
Summary Since its discovery more th
- Page 36 and 37:
xxxiv
- Page 38 and 39:
CONTENTS 1.6.1 The K-correction . .
- Page 40 and 41:
CONTENTS 5.3.2 Analytical model . .
- Page 42 and 43:
LIST OF FIGURES 4.6 Soft 1 − P µ
- Page 45 and 46:
Chapter 1 Introduction In the last
- Page 47 and 48:
CHAPTER 1: INTRODUCTION have confir
- Page 49 and 50:
CHAPTER 1: INTRODUCTION by this mis
- Page 51 and 52:
CHAPTER 1: INTRODUCTION Figure 1.2
- Page 53 and 54:
CHAPTER 1: INTRODUCTION [161], [242
- Page 55 and 56:
CHAPTER 1: INTRODUCTION tant contri
- Page 57 and 58:
CHAPTER 1: INTRODUCTION to-noise ra
- Page 59 and 60:
CHAPTER 1: INTRODUCTION Compton up-
- Page 61 and 62:
CHAPTER 1: INTRODUCTION ([142]). It
- Page 63 and 64:
CHAPTER 1: INTRODUCTION (NLR) and i
- Page 65 and 66:
CHAPTER 1: INTRODUCTION optically c
- Page 67 and 68:
CHAPTER 1: INTRODUCTION ber of AGN
- Page 69 and 70:
CHAPTER 1: INTRODUCTION Figure 1.5
- Page 71 and 72:
CHAPTER 1: INTRODUCTION 1.7.3 The X
- Page 73 and 74:
CHAPTER 1: INTRODUCTION AGN are ess
- Page 75:
CHAPTER 1: INTRODUCTION subjects ma
- Page 78 and 79:
CHAPTER 2: AGN SURVEYS WITH XMM-New
- Page 80 and 81:
CHAPTER 2: AGN SURVEYS WITH XMM-New
- Page 82 and 83:
CHAPTER 2: AGN SURVEYS WITH XMM-New
- Page 84 and 85:
R R OQP ONM 40 Table 2.1: Continued
- Page 86 and 87:
CHAPTER 2: AGN SURVEYS WITH XMM-New
- Page 88 and 89:
CHAPTER 2: AGN SURVEYS WITH XMM-New
- Page 90 and 91:
CHAPTER 2: AGN SURVEYS WITH XMM-New
- Page 92 and 93:
CHAPTER 2: AGN SURVEYS WITH XMM-New
- Page 94 and 95:
CHAPTER 2: AGN SURVEYS WITH XMM-New
- Page 96 and 97:
CHAPTER 2: AGN SURVEYS WITH XMM-New
- Page 99 and 100:
Chapter 3 Source counts of the AXIS
- Page 101 and 102:
CHAPTER 3: SOURCE COUNTS OF THE AXI
- Page 103 and 104:
CHAPTER 3: SOURCE COUNTS OF THE AXI
- Page 105 and 106:
61 Table 3.1 Maximum likelihood fit
- Page 107 and 108:
CHAPTER 3: SOURCE COUNTS OF THE AXI
- Page 109 and 110:
CHAPTER 3: SOURCE COUNTS OF THE AXI
- Page 111 and 112:
CHAPTER 3: SOURCE COUNTS OF THE AXI
- Page 113 and 114:
CHAPTER 3: SOURCE COUNTS OF THE AXI
- Page 115 and 116:
CHAPTER 3: SOURCE COUNTS OF THE AXI
- Page 117 and 118:
CHAPTER 3: SOURCE COUNTS OF THE AXI
- Page 119 and 120:
CHAPTER 3: SOURCE COUNTS OF THE AXI
- Page 121 and 122:
CHAPTER 3: SOURCE COUNTS OF THE AXI
- Page 123 and 124:
CHAPTER 3: SOURCE COUNTS OF THE AXI
- Page 125:
CHAPTER 3: SOURCE COUNTS OF THE AXI
- Page 128 and 129:
CHAPTER 4: CLUSTERING OF AXIS AND X
- Page 130 and 131:
CHAPTER 4: CLUSTERING OF AXIS AND X
- Page 132 and 133:
CHAPTER 4: CLUSTERING OF AXIS AND X
- Page 134 and 135:
CHAPTER 4: CLUSTERING OF AXIS AND X
- Page 136 and 137:
CHAPTER 4: CLUSTERING OF AXIS AND X
- Page 138 and 139:
CHAPTER 4: CLUSTERING OF AXIS AND X
- Page 140 and 141:
CHAPTER 4: CLUSTERING OF AXIS AND X
- Page 142 and 143:
CHAPTER 4: CLUSTERING OF AXIS AND X
- Page 144 and 145:
CHAPTER 4: CLUSTERING OF AXIS AND X
- Page 146 and 147:
CHAPTER 4: CLUSTERING OF AXIS AND X
- Page 148 and 149:
CHAPTER 4: CLUSTERING OF AXIS AND X
- Page 150 and 151: CHAPTER 4: CLUSTERING OF AXIS AND X
- Page 152 and 153: CHAPTER 4: CLUSTERING OF AXIS AND X
- Page 154 and 155: CHAPTER 4: CLUSTERING OF AXIS AND X
- Page 156: CHAPTER 4: CLUSTERING OF AXIS AND X
- Page 159 and 160: Chapter 5 Luminosity function of XM
- Page 161 and 162: CHAPTER 5: LUMINOSITY FUNCTION OF X
- Page 163 and 164: CHAPTER 5: LUMINOSITY FUNCTION OF X
- Page 165 and 166: CHAPTER 5: LUMINOSITY FUNCTION OF X
- Page 167 and 168: CHAPTER 5: LUMINOSITY FUNCTION OF X
- Page 169 and 170: CHAPTER 5: LUMINOSITY FUNCTION OF X
- Page 171 and 172: CHAPTER 5: LUMINOSITY FUNCTION OF X
- Page 173 and 174: CHAPTER 5: LUMINOSITY FUNCTION OF X
- Page 175 and 176: CHAPTER 5: LUMINOSITY FUNCTION OF X
- Page 177 and 178: CHAPTER 5: LUMINOSITY FUNCTION OF X
- Page 179 and 180: CHAPTER 5: LUMINOSITY FUNCTION OF X
- Page 181 and 182: CHAPTER 5: LUMINOSITY FUNCTION OF X
- Page 183 and 184: CHAPTER 5: LUMINOSITY FUNCTION OF X
- Page 185 and 186: CHAPTER 5: LUMINOSITY FUNCTION OF X
- Page 187 and 188: CHAPTER 5: LUMINOSITY FUNCTION OF X
- Page 190 and 191: CHAPTER 5: LUMINOSITY FUNCTION OF X
- Page 192 and 193: CHAPTER 6: SUMMARY OF THE RESULTS s
- Page 194 and 195: CHAPTER 6: SUMMARY OF THE RESULTS b
- Page 196 and 197: CHAPTER 6: SUMMARY OF THE RESULTS F
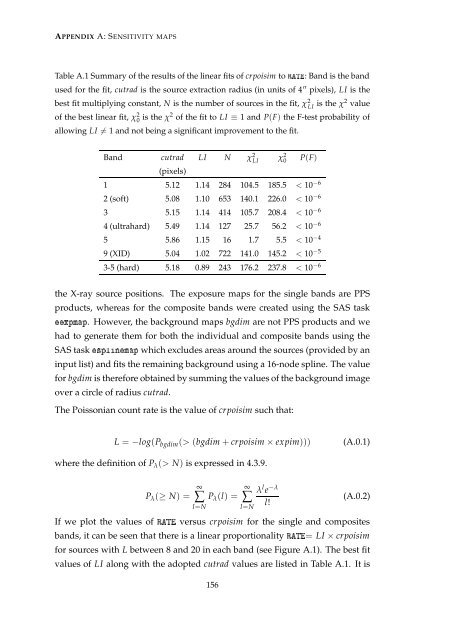
- Page 199: Appendix A Sensitivity maps The val
- Page 204 and 205: APPENDIX A: SENSITIVITY MAPS 160
- Page 206 and 207: REFERENCES [16] Barger, A. J., Cowi
- Page 208 and 209: REFERENCES [61] Ehle, M., Breitfell
- Page 210 and 211: REFERENCES [107] Hawkins, M. R. S.
- Page 212 and 213: REFERENCES [148] Matarrese, S., Col
- Page 214 and 215: REFERENCES [190] Richstone, D., Ahj
- Page 216: REFERENCES [236] Wisotzky, L., 1998