

pdf - SRON
pdf - SRON
pdf - SRON

You also want an ePaper? Increase the reach of your titles
YUMPU automatically turns print PDFs into web optimized ePapers that Google loves.
CHAPTER 2: AGN SURVEYS WITH XMM-Newton<br />
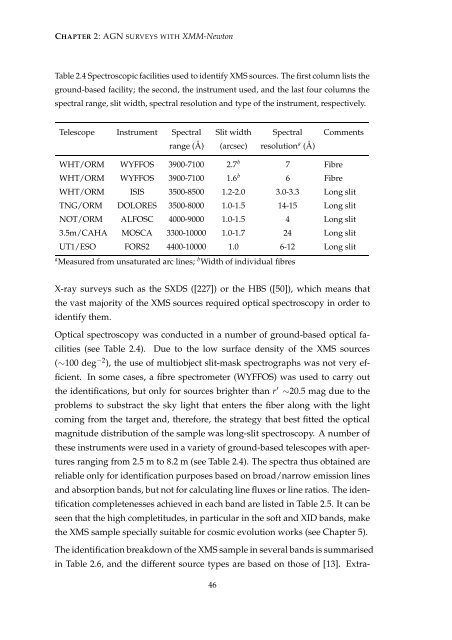
Table 2.4 Spectroscopic facilities used to identify XMS sources. The first column lists the<br />
ground-based facility; the second, the instrument used, and the last four columns the<br />
spectral range, slit width, spectral resolution and type of the instrument, respectively.<br />
Telescope Instrument Spectral Slit width Spectral Comments<br />
range (Å) (arcsec) resolution a (Å)<br />
WHT/ORM WYFFOS 3900-7100 2.7 b 7 Fibre<br />
WHT/ORM WYFFOS 3900-7100 1.6 b 6 Fibre<br />
WHT/ORM ISIS 3500-8500 1.2-2.0 3.0-3.3 Long slit<br />
TNG/ORM DOLORES 3500-8000 1.0-1.5 14-15 Long slit<br />
NOT/ORM ALFOSC 4000-9000 1.0-1.5 4 Long slit<br />
3.5m/CAHA MOSCA 3300-10000 1.0-1.7 24 Long slit<br />
UT1/ESO FORS2 4400-10000 1.0 6-12 Long slit<br />
a Measured from unsaturated arc lines; b Width of individual fibres<br />
X-ray surveys such as the SXDS ([227]) or the HBS ([50]), which means that<br />
the vast majority of the XMS sources required optical spectroscopy in order to<br />
identify them.<br />
Optical spectroscopy was conducted in a number of ground-based optical facilities<br />
(see Table 2.4). Due to the low surface density of the XMS sources<br />
(∼100 deg −2 ), the use of multiobject slit-mask spectrographs was not very efficient.<br />
In some cases, a fibre spectrometer (WYFFOS) was used to carry out<br />
the identifications, but only for sources brighter than r ′ ∼20.5 mag due to the<br />
problems to substract the sky light that enters the fiber along with the light<br />
coming from the target and, therefore, the strategy that best fitted the optical<br />
magnitude distribution of the sample was long-slit spectroscopy. A number of<br />
these instruments were used in a variety of ground-based telescopes with apertures<br />
ranging from 2.5 m to 8.2 m (see Table 2.4). The spectra thus obtained are<br />
reliable only for identification purposes based on broad/narrow emission lines<br />
and absorption bands, but not for calculating line fluxes or line ratios. The identification<br />
completenesses achieved in each band are listed in Table 2.5. It can be<br />
seen that the high completitudes, in particular in the soft and XID bands, make<br />
the XMS sample specially suitable for cosmic evolution works (see Chapter 5).<br />
The identification breakdown of the XMS sample in several bands is summarised<br />
in Table 2.6, and the different source types are based on those of [13]. Extra-<br />
46


