

pdf - SRON
pdf - SRON
pdf - SRON

You also want an ePaper? Increase the reach of your titles
YUMPU automatically turns print PDFs into web optimized ePapers that Google loves.
CHAPTER 5: LUMINOSITY FUNCTION OF XMS SOURCES<br />
log N h<br />
20 22 24<br />
AGN1<br />
AGN2<br />
42 42.5 43 43.5 44 44.5<br />
log L x (4.5−7.5 keV)<br />
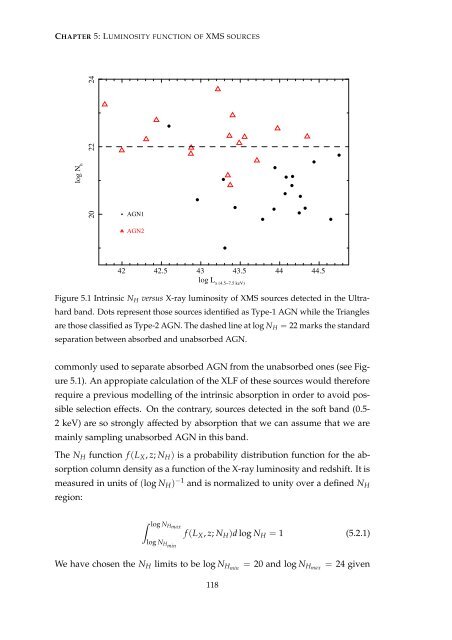
Figure 5.1 Intrinsic N H versus X-ray luminosity of XMS sources detected in the Ultrahard<br />
band. Dots represent those sources identified as Type-1 AGN while the Triangles<br />
are those classified as Type-2 AGN. The dashed line at log N H = 22 marks the standard<br />
separation between absorbed and unabsorbed AGN.<br />
commonly used to separate absorbed AGN from the unabsorbed ones (see Figure<br />
5.1). An appropiate calculation of the XLF of these sources would therefore<br />
require a previous modelling of the intrinsic absorption in order to avoid possible<br />
selection effects. On the contrary, sources detected in the soft band (0.5-<br />
2 keV) are so strongly affected by absorption that we can assume that we are<br />
mainly sampling unabsorbed AGN in this band.<br />
The N H function f (L X , z; N H ) is a probability distribution function for the absorption<br />
column density as a function of the X-ray luminosity and redshift. It is<br />
measured in units of (log N H ) −1 and is normalized to unity over a defined N H<br />
region:<br />
∫ log NH max<br />
f (L X , z; N H )d log N H = 1 (5.2.1)<br />
log N Hmin<br />
We have chosen the N H limits to be log N Hmin = 20 and log N Hmax = 24 given<br />
118


