Examination of the intact stability and the seakeeping behaviour
Examination of the intact stability and the seakeeping behaviour
Examination of the intact stability and the seakeeping behaviour

Create successful ePaper yourself
Turn your PDF publications into a flip-book with our unique Google optimized e-Paper software.
4 <strong>Examination</strong><br />
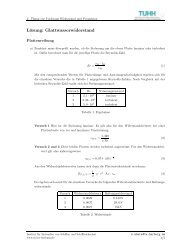
For each vessel <strong>the</strong> <strong>seakeeping</strong> behavior during <strong>the</strong> three accident situations is determined. This<br />
simulation extends to 20, 000 time steps, having a step size <strong>of</strong> 0.5 s each. This corresponds to a<br />
total duration <strong>of</strong> <strong>the</strong> simulation in real time <strong>of</strong> 10, 000 s.<br />
This chapter explains <strong>the</strong> data sets for all analysed vessels. The compilation contains a simplied<br />
lines plan including <strong>the</strong> lateral areas <strong>and</strong> a few main dimensions. A detailed list <strong>of</strong> all<br />
main dimensions <strong>and</strong> <strong>the</strong> data for <strong>the</strong> respective ballast arrival loading condition can be found<br />
in <strong>the</strong> appendix A. In addition, some specic characteristics <strong>of</strong> <strong>the</strong> ship are named. (e.g. <strong>the</strong><br />
quality <strong>of</strong> <strong>the</strong> calculation model or <strong>the</strong> hullform). At this <strong>the</strong> explanations concerning <strong>the</strong> ability<br />
<strong>of</strong> passing <strong>the</strong> Panama Canal, apply on <strong>the</strong> canal before its enlarging, which will be completed<br />
in <strong>the</strong> year 2014/2015. Fur<strong>the</strong>r with <strong>the</strong> referenced c B value for each vessel, <strong>the</strong> neness <strong>of</strong> <strong>the</strong><br />
hull forms is described <strong>and</strong> can be compared to o<strong>the</strong>r vessels.<br />
Fur<strong>the</strong>rmore <strong>the</strong> maximum rolling angles <strong>and</strong> maximum transversal accelerations on <strong>the</strong> bridge<br />
are given, resulting from each <strong>of</strong> <strong>the</strong> three above named accident situations. For <strong>the</strong> worst scenario<br />
<strong>the</strong> statistical distribution <strong>of</strong> <strong>the</strong> occurring accelerations is given by a histogram, where <strong>the</strong><br />
maximum transversal acceleration is derived from. The mean value <strong>of</strong> <strong>the</strong> normalized amplitudes<br />
<strong>and</strong> <strong>the</strong> associated st<strong>and</strong>ard deviation as well as <strong>the</strong> number <strong>of</strong> calculated periods in <strong>the</strong> simulation<br />
time <strong>of</strong> 10, 000 s are also shown in <strong>the</strong> histogram. It is to be noted, that <strong>the</strong> histograms<br />
do not have <strong>the</strong> same scale on <strong>the</strong>ir x-axis. So <strong>the</strong> histograms <strong>of</strong> two dierent vessels can not be<br />
compared directly. The order <strong>of</strong> <strong>the</strong> analysed vessels is r<strong>and</strong>omly chosen.<br />
4.1 Vessel No. 01<br />
Figure 4.1: Lines plan <strong>and</strong> lateral areas <strong>of</strong> Vessel No. 01<br />
Table 4.1: Main dimensions <strong>of</strong> Vessel No. 01<br />
Main dimensions Value Unit<br />
L pp 263.00 [m]<br />
B 40.00 [m]<br />
T D 12.00 [m]<br />
Containers 5,512 [TEU]<br />
The rst analysed vessel has <strong>the</strong> geometric capacity to carry 5, 512 T EU. Having <strong>the</strong> main<br />
dimensions according to table 4.1, this vessels must be classied as a smaller Post-Panamax<br />
19