BTEC First Award in Application of Science - specification - Edexcel
BTEC First Award in Application of Science - specification - Edexcel
BTEC First Award in Application of Science - specification - Edexcel

Create successful ePaper yourself
Turn your PDF publications into a flip-book with our unique Google optimized e-Paper software.
UNIT 8: SCIENTIFIC SKILLS<br />
What needs to be learnt<br />
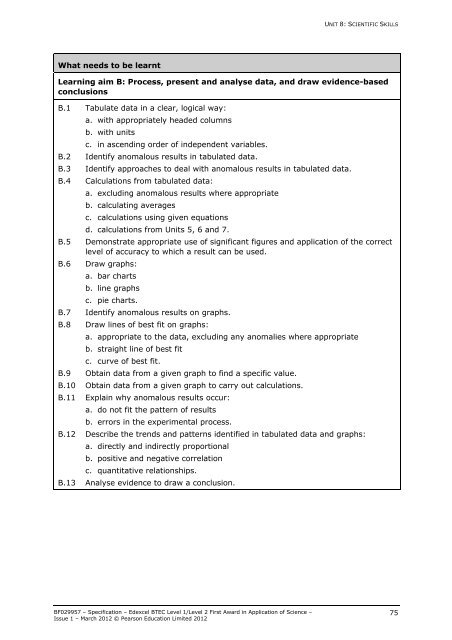
Learn<strong>in</strong>g aim B: Process, present and analyse data, and draw evidence-based<br />
conclusions<br />
B.1 Tabulate data <strong>in</strong> a clear, logical way:<br />
a. with appropriately headed columns<br />
b. with units<br />
c. <strong>in</strong> ascend<strong>in</strong>g order <strong>of</strong> <strong>in</strong>dependent variables.<br />
B.2 Identify anomalous results <strong>in</strong> tabulated data.<br />
B.3 Identify approaches to deal with anomalous results <strong>in</strong> tabulated data.<br />
B.4 Calculations from tabulated data:<br />
a. exclud<strong>in</strong>g anomalous results where appropriate<br />
b. calculat<strong>in</strong>g averages<br />
c. calculations us<strong>in</strong>g given equations<br />
d. calculations from Units 5, 6 and 7.<br />
B.5 Demonstrate appropriate use <strong>of</strong> significant figures and application <strong>of</strong> the correct<br />
level <strong>of</strong> accuracy to which a result can be used.<br />
B.6 Draw graphs:<br />
a. bar charts<br />
b. l<strong>in</strong>e graphs<br />
c. pie charts.<br />
B.7 Identify anomalous results on graphs.<br />
B.8 Draw l<strong>in</strong>es <strong>of</strong> best fit on graphs:<br />
a. appropriate to the data, exclud<strong>in</strong>g any anomalies where appropriate<br />
b. straight l<strong>in</strong>e <strong>of</strong> best fit<br />
c. curve <strong>of</strong> best fit.<br />
B.9 Obta<strong>in</strong> data from a given graph to f<strong>in</strong>d a specific value.<br />
B.10 Obta<strong>in</strong> data from a given graph to carry out calculations.<br />
B.11 Expla<strong>in</strong> why anomalous results occur:<br />
a. do not fit the pattern <strong>of</strong> results<br />
b. errors <strong>in</strong> the experimental process.<br />
B.12 Describe the trends and patterns identified <strong>in</strong> tabulated data and graphs:<br />
a. directly and <strong>in</strong>directly proportional<br />
b. positive and negative correlation<br />
c. quantitative relationships.<br />
B.13 Analyse evidence to draw a conclusion.<br />
BF029957 – Specification – <strong>Edexcel</strong> <strong>BTEC</strong> Level 1/Level 2 <strong>First</strong> <strong>Award</strong> <strong>in</strong> <strong>Application</strong> <strong>of</strong> <strong>Science</strong> –<br />
Issue 1 – March 2012 © Pearson Education Limited 2012<br />
75