comprehensive annual financial report - City of St. Petersburg
comprehensive annual financial report - City of St. Petersburg
comprehensive annual financial report - City of St. Petersburg

Create successful ePaper yourself
Turn your PDF publications into a flip-book with our unique Google optimized e-Paper software.
<strong>City</strong> <strong>of</strong> <strong>St</strong>. <strong>Petersburg</strong>, FL<br />
Management’s Discussion and Analysis<br />
For the Year Ended September 30, 2010<br />
Unaudited<br />
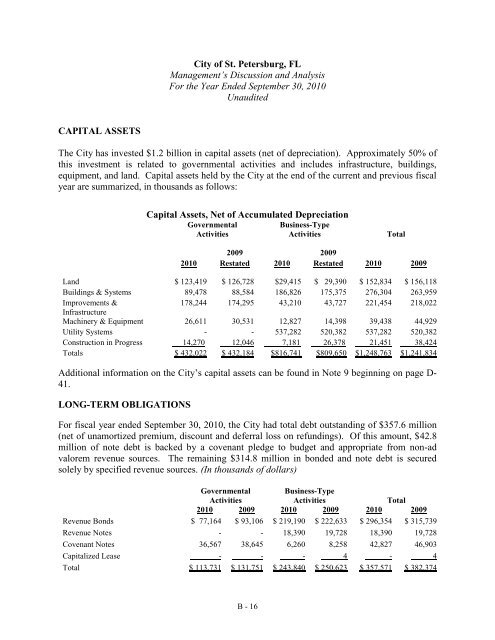
CAPITAL ASSETS<br />
The <strong>City</strong> has invested $1.2 billion in capital assets (net <strong>of</strong> depreciation). Approximately 50% <strong>of</strong><br />
this investment is related to governmental activities and includes infrastructure, buildings,<br />
equipment, and land. Capital assets held by the <strong>City</strong> at the end <strong>of</strong> the current and previous fiscal<br />
year are summarized, in thousands as follows:<br />
Capital Assets, Net <strong>of</strong> Accumulated Depreciation<br />
Governmental<br />
Activities<br />
Business-Type<br />
Activities<br />
Total<br />
2009 2009<br />
2010 Restated 2010 Restated 2010 2009<br />
Land $ 123,419 $ 126,728 $29,415 $ 29,390 $ 152,834 $ 156,118<br />
Buildings & Systems 89,478 88,584 186,826 175,375 276,304 263,959<br />
Improvements &<br />
178,244 174,295 43,210 43,727 221,454 218,022<br />
Infrastructure<br />
Machinery & Equipment 26,611 30,531 12,827 14,398 39,438 44,929<br />
Utility Systems - - 537,282 520,382 537,282 520,382<br />
Construction in Progress 14,270 12,046 7,181 26,378 21,451 38,424<br />
Totals $ 432,022 $ 432,184 $816,741 $809,650 $1,248,763 $1,241,834<br />
Additional information on the <strong>City</strong>’s capital assets can be found in Note 9 beginning on page D-<br />
41.<br />
LONG-TERM OBLIGATIONS<br />
For fiscal year ended September 30, 2010, the <strong>City</strong> had total debt outstanding <strong>of</strong> $357.6 million<br />
(net <strong>of</strong> unamortized premium, discount and deferral loss on refundings). Of this amount, $42.8<br />
million <strong>of</strong> note debt is backed by a covenant pledge to budget and appropriate from non-ad<br />
valorem revenue sources. The remaining $314.8 million in bonded and note debt is secured<br />
solely by specified revenue sources. (In thousands <strong>of</strong> dollars)<br />
Governmental<br />
Activities<br />
Business-Type<br />
Activities<br />
Total<br />
2010 2009 2010 2009 2010 2009<br />
Revenue Bonds $ 77,164 $ 93,106 $ 219,190 $ 222,633 $ 296,354 $ 315,739<br />
Revenue Notes - - 18,390 19,728 18,390 19,728<br />
Covenant Notes 36,567 38,645 6,260 8,258 42,827 46,903<br />
Capitalized Lease - - - 4 - 4<br />
Total $ 113,731 $ 131,751 $ 243,840 $ 250,623 $ 357,571 $ 382,374<br />
B - 16