Numerical Simulation of the Dynamics of Turbulent Swirling Flames
Numerical Simulation of the Dynamics of Turbulent Swirling Flames
Numerical Simulation of the Dynamics of Turbulent Swirling Flames

Create successful ePaper yourself
Turn your PDF publications into a flip-book with our unique Google optimized e-Paper software.
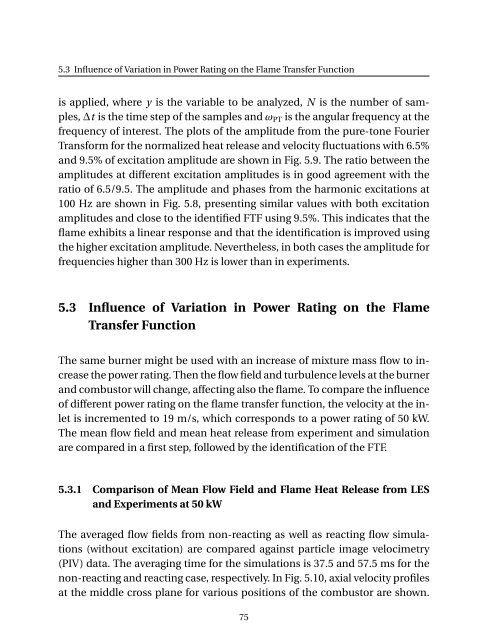
5.3 Influence <strong>of</strong> Variation in Power Rating on <strong>the</strong> Flame Transfer Function<br />
is applied, where y is <strong>the</strong> variable to be analyzed, N is <strong>the</strong> number <strong>of</strong> samples,<br />
∆t is <strong>the</strong> time step <strong>of</strong> <strong>the</strong> samples and ω PT is <strong>the</strong> angular frequency at <strong>the</strong><br />
frequency <strong>of</strong> interest. The plots <strong>of</strong> <strong>the</strong> amplitude from <strong>the</strong> pure-tone Fourier<br />
Transform for <strong>the</strong> normalized heat release and velocity fluctuations with 6.5%<br />
and 9.5% <strong>of</strong> excitation amplitude are shown in Fig. 5.9. The ratio between <strong>the</strong><br />
amplitudes at different excitation amplitudes is in good agreement with <strong>the</strong><br />
ratio <strong>of</strong> 6.5/9.5. The amplitude and phases from <strong>the</strong> harmonic excitations at<br />
100 Hz are shown in Fig. 5.8, presenting similar values with both excitation<br />
amplitudes and close to <strong>the</strong> identified FTF using 9.5%. This indicates that <strong>the</strong><br />
flame exhibits a linear response and that <strong>the</strong> identification is improved using<br />
<strong>the</strong> higher excitation amplitude. Never<strong>the</strong>less, in both cases <strong>the</strong> amplitude for<br />
frequencies higher than 300 Hz is lower than in experiments.<br />
5.3 Influence <strong>of</strong> Variation in Power Rating on <strong>the</strong> Flame<br />
Transfer Function<br />
The same burner might be used with an increase <strong>of</strong> mixture mass flow to increase<br />
<strong>the</strong> power rating. Then <strong>the</strong> flow field and turbulence levels at <strong>the</strong> burner<br />
and combustor will change, affecting also <strong>the</strong> flame. To compare <strong>the</strong> influence<br />
<strong>of</strong> different power rating on <strong>the</strong> flame transfer function, <strong>the</strong> velocity at <strong>the</strong> inlet<br />
is incremented to 19 m/s, which corresponds to a power rating <strong>of</strong> 50 kW.<br />
The mean flow field and mean heat release from experiment and simulation<br />
are compared in a first step, followed by <strong>the</strong> identification <strong>of</strong> <strong>the</strong> FTF.<br />
5.3.1 Comparison <strong>of</strong> Mean Flow Field and Flame Heat Release from LES<br />
and Experiments at 50 kW<br />
The averaged flow fields from non-reacting as well as reacting flow simulations<br />
(without excitation) are compared against particle image velocimetry<br />
(PIV) data. The averaging time for <strong>the</strong> simulations is 37.5 and 57.5 ms for <strong>the</strong><br />
non-reacting and reacting case, respectively. In Fig. 5.10, axial velocity pr<strong>of</strong>iles<br />
at <strong>the</strong> middle cross plane for various positions <strong>of</strong> <strong>the</strong> combustor are shown.<br />
75