Quality Progress - American Society for Quality
Quality Progress - American Society for Quality
Quality Progress - American Society for Quality
Create successful ePaper yourself
Turn your PDF publications into a flip-book with our unique Google optimized e-Paper software.
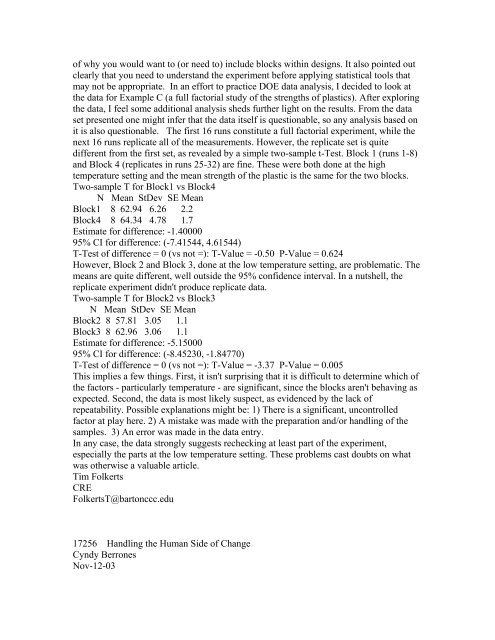
of why you would want to (or need to) include blocks within designs. It also pointed out<br />
clearly that you need to understand the experiment be<strong>for</strong>e applying statistical tools that<br />
may not be appropriate. In an ef<strong>for</strong>t to practice DOE data analysis, I decided to look at<br />
the data <strong>for</strong> Example C (a full factorial study of the strengths of plastics). After exploring<br />
the data, I feel some additional analysis sheds further light on the results. From the data<br />
set presented one might infer that the data itself is questionable, so any analysis based on<br />
it is also questionable. The first 16 runs constitute a full factorial experiment, while the<br />
next 16 runs replicate all of the measurements. However, the replicate set is quite<br />
different from the first set, as revealed by a simple two-sample t-Test. Block 1 (runs 1-8)<br />
and Block 4 (replicates in runs 25-32) are fine. These were both done at the high<br />
temperature setting and the mean strength of the plastic is the same <strong>for</strong> the two blocks.<br />
Two-sample T <strong>for</strong> Block1 vs Block4<br />
N Mean StDev SE Mean<br />
Block1 8 62.94 6.26 2.2<br />
Block4 8 64.34 4.78 1.7<br />
Estimate <strong>for</strong> difference: -1.40000<br />
95% CI <strong>for</strong> difference: (-7.41544, 4.61544)<br />
T-Test of difference = 0 (vs not =): T-Value = -0.50 P-Value = 0.624<br />
However, Block 2 and Block 3, done at the low temperature setting, are problematic. The<br />
means are quite different, well outside the 95% confidence interval. In a nutshell, the<br />
replicate experiment didn't produce replicate data.<br />
Two-sample T <strong>for</strong> Block2 vs Block3<br />
N Mean StDev SE Mean<br />
Block2 8 57.81 3.05 1.1<br />
Block3 8 62.96 3.06 1.1<br />
Estimate <strong>for</strong> difference: -5.15000<br />
95% CI <strong>for</strong> difference: (-8.45230, -1.84770)<br />
T-Test of difference = 0 (vs not =): T-Value = -3.37 P-Value = 0.005<br />
This implies a few things. First, it isn't surprising that it is difficult to determine which of<br />
the factors - particularly temperature - are significant, since the blocks aren't behaving as<br />
expected. Second, the data is most likely suspect, as evidenced by the lack of<br />
repeatability. Possible explanations might be: 1) There is a significant, uncontrolled<br />
factor at play here. 2) A mistake was made with the preparation and/or handling of the<br />
samples. 3) An error was made in the data entry.<br />
In any case, the data strongly suggests rechecking at least part of the experiment,<br />
especially the parts at the low temperature setting. These problems cast doubts on what<br />
was otherwise a valuable article.<br />
Tim Folkerts<br />
CRE<br />
FolkertsT@bartonccc.edu<br />
17256 Handling the Human Side of Change<br />
Cyndy Berrones<br />
Nov-12-03


