Quality Progress - American Society for Quality
Quality Progress - American Society for Quality
Quality Progress - American Society for Quality

Create successful ePaper yourself
Turn your PDF publications into a flip-book with our unique Google optimized e-Paper software.
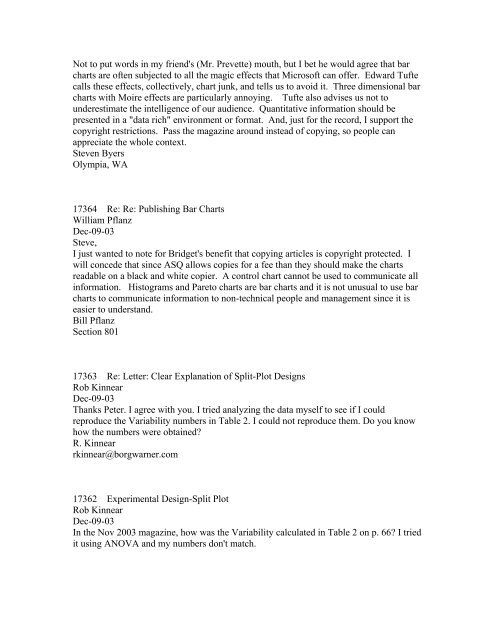
Not to put words in my friend's (Mr. Prevette) mouth, but I bet he would agree that bar<br />
charts are often subjected to all the magic effects that Microsoft can offer. Edward Tufte<br />
calls these effects, collectively, chart junk, and tells us to avoid it. Three dimensional bar<br />
charts with Moire effects are particularly annoying. Tufte also advises us not to<br />
underestimate the intelligence of our audience. Quantitative in<strong>for</strong>mation should be<br />
presented in a "data rich" environment or <strong>for</strong>mat. And, just <strong>for</strong> the record, I support the<br />
copyright restrictions. Pass the magazine around instead of copying, so people can<br />
appreciate the whole context.<br />
Steven Byers<br />
Olympia, WA<br />
17364 Re: Re: Publishing Bar Charts<br />
William Pflanz<br />
Dec-09-03<br />
Steve,<br />
I just wanted to note <strong>for</strong> Bridget's benefit that copying articles is copyright protected. I<br />
will concede that since ASQ allows copies <strong>for</strong> a fee than they should make the charts<br />
readable on a black and white copier. A control chart cannot be used to communicate all<br />
in<strong>for</strong>mation. Histograms and Pareto charts are bar charts and it is not unusual to use bar<br />
charts to communicate in<strong>for</strong>mation to non-technical people and management since it is<br />
easier to understand.<br />
Bill Pflanz<br />
Section 801<br />
17363 Re: Letter: Clear Explanation of Split-Plot Designs<br />
Rob Kinnear<br />
Dec-09-03<br />
Thanks Peter. I agree with you. I tried analyzing the data myself to see if I could<br />
reproduce the Variability numbers in Table 2. I could not reproduce them. Do you know<br />
how the numbers were obtained?<br />
R. Kinnear<br />
rkinnear@borgwarner.com<br />
17362 Experimental Design-Split Plot<br />
Rob Kinnear<br />
Dec-09-03<br />
In the Nov 2003 magazine, how was the Variability calculated in Table 2 on p. 66? I tried<br />
it using ANOVA and my numbers don't match.