Close Brothers Seydler Research AG - BVB Aktie - Borussia Dortmund
Close Brothers Seydler Research AG - BVB Aktie - Borussia Dortmund
Close Brothers Seydler Research AG - BVB Aktie - Borussia Dortmund

You also want an ePaper? Increase the reach of your titles
YUMPU automatically turns print PDFs into web optimized ePapers that Google loves.
8<br />
<strong>Borussia</strong> <strong>Dortmund</strong> GmbH & CO KGaA<br />
reason for this adjustment was mainly due to high volatility of the share price as<br />
well as the positive upside potential related to success of the current sporting<br />
success. With the high beta we furthermore took also into account the cyclical<br />
characteristics of company´s business and the higher volatility at equity markets<br />
and high revenue variability in the past. We furthermore assumed a long-term<br />
target equity ratio of 70%. These premises lead to a WACC of 10.12%.<br />
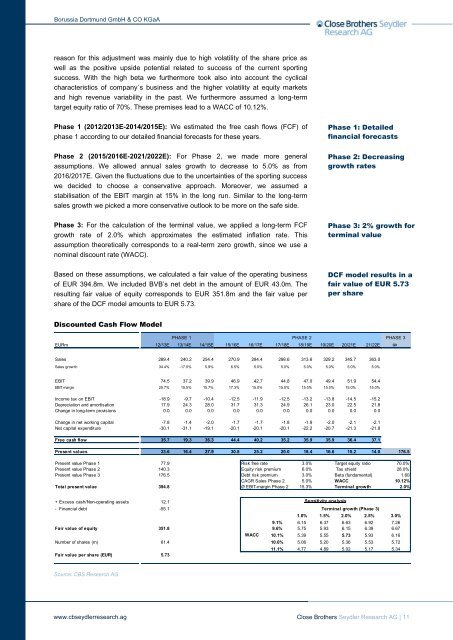
Phase 1 (2012/2013E-2014/2015E): We estimated the free cash flows (FCF) of<br />
phase 1 according to our detailed financial forecasts for these years.<br />
Phase 1: Detailed<br />
financial forecasts<br />
Phase 2 (2015/2016E-2021/2022E): For Phase 2, we made more general<br />
assumptions. We allowed annual sales growth to decrease to 5.0% as from<br />
2016/2017E. Given the fluctuations due to the uncertainties of the sporting success<br />
we decided to choose a conservative approach. Moreover, we assumed a<br />
stabilisation of the EBIT margin at 15% in the long run. Similar to the long-term<br />
sales growth we picked a more conservative outlook to be more on the safe side.<br />
Phase 2: Decreasing<br />
growth rates<br />
Phase 3: For the calculation of the terminal value, we applied a long-term FCF<br />
growth rate of 2.0% which approximates the estimated inflation rate. This<br />
assumption theoretically corresponds to a real-term zero growth, since we use a<br />
nominal discount rate (WACC).<br />
Phase 3: 2% growth for<br />
terminal value<br />
Based on these assumptions, we calculated a fair value of the operating business<br />
of EUR 394.8m. We included <strong>BVB</strong>’s net debt in the amount of EUR 43.0m. The<br />
resulting fair value of equity corresponds to EUR 351.8m and the fair value per<br />
share of the DCF model amounts to EUR 5.73.<br />
DCF model results in a<br />
fair value of EUR 5.73<br />
per share<br />
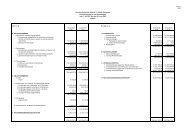
Discounted Cash Flow Model<br />
PHASE 1 PHASE 2 PHASE 3<br />
EURm 12/13E 13/14E 14/15E 15/16E 16/17E 17/18E 18/19E 19/20E 20/21E 21/22E<br />
Sales 289.4 240.2 254.4 270.9 284.4 298.6 313.6 329.2 345.7 363.0<br />
Sales grow th 34.4% -17.0% 5.9% 6.5% 5.0% 5.0% 5.0% 5.0% 5.0% 5.0%<br />
EBIT 74.5 37.2 39.9 46.9 42.7 44.8 47.0 49.4 51.9 54.4<br />
EBIT margin 25.7% 15.5% 15.7% 17.3% 15.0% 15.0% 15.0% 15.0% 15.0% 15.0%<br />
Income tax on EBIT -18.9 -9.7 -10.4 -12.5 -11.9 -12.5 -13.2 -13.8 -14.5 -15.2<br />
Depreciation and amortisation 17.9 24.3 28.0 31.7 31.3 24.9 26.1 23.0 22.5 21.8<br />
Change in long-term provisions 0.0 0.0 0.0 0.0 0.0 0.0 0.0 0.0 0.0 0.0<br />
Change in net working capital -7.8 -1.4 -2.0 -1.7 -1.7 -1.8 -1.9 -2.0 -2.1 -2.1<br />
Net capital expenditure -30.1 -31.1 -19.1 -20.1 -20.1 -20.1 -22.2 -20.7 -21.3 -21.8<br />
Free cash flow 35.7 19.3 36.3 44.4 40.2 35.2 35.9 35.9 36.4 37.1<br />
Present values 33.6 16.4 27.9 30.8 25.2 20.0 18.4 16.6 15.2 14.0 176.5<br />
Present value Phase 1 77.9 Risk free rate 3.0% Target equity ratio 70.0%<br />
Present value Phase 2 140.3 Equity risk premium 6.0% Tax shield 28.0%<br />
Present value Phase 3 176.5 Debt risk premium 3.0% Beta (fundamental) 1.60<br />
C<strong>AG</strong>R Sales Phase 2 5.0% WACC 10.12%<br />
Total present value 394.8 Ø EBIT-margin Phase 2 15.3% Terminal growth 2.0%<br />
+ Excess cash/Non-operating assets 12.1<br />
- Financial debt -55.1<br />
1.0% 1.5% 2.0% 2.5% 3.0%<br />
9.1% 6.15 6.37 6.63 6.92 7.26<br />
Fair value of equity 351.8 9.6% 5.75 5.93 6.15 6.39 6.67<br />
WACC 10.1% 5.39 5.55 5.73 5.93 6.16<br />
Number of shares (m) 61.4 10.6% 5.06 5.20 5.36 5.53 5.72<br />
Fair value per share (EUR) 5.73<br />
Sensitivity analysis<br />
Terminal growth (Phase 3)<br />
11.1% 4.77 4.89 5.02 5.17 5.34<br />
Source: CBS <strong>Research</strong> <strong>AG</strong><br />
www.cbseydlerresearch.ag <strong>Close</strong> <strong>Brothers</strong> <strong>Seydler</strong> <strong>Research</strong> <strong>AG</strong> | 11