Close Brothers Seydler Research AG - BVB Aktie - Borussia Dortmund
Close Brothers Seydler Research AG - BVB Aktie - Borussia Dortmund
Close Brothers Seydler Research AG - BVB Aktie - Borussia Dortmund

You also want an ePaper? Increase the reach of your titles
YUMPU automatically turns print PDFs into web optimized ePapers that Google loves.
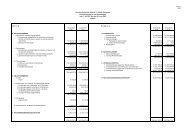
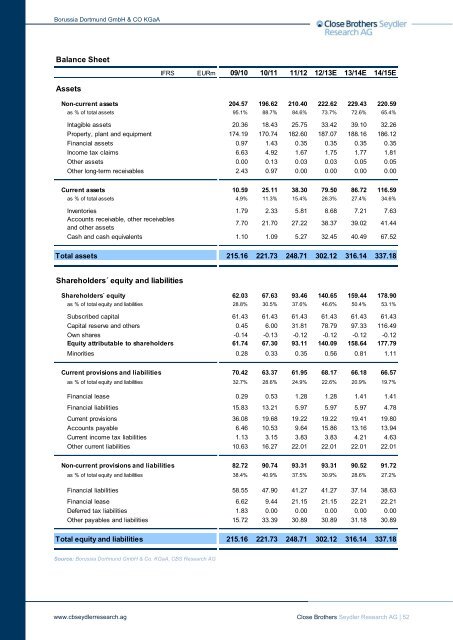
<strong>Borussia</strong> <strong>Dortmund</strong> GmbH & CO KGaA<br />
Balance Sheet<br />
IFRS EURm 09/10 10/11 11/12 12/13E 13/14E 14/15E<br />
Assets<br />
Non-current assets 204.57 196.62 210.40 222.62 229.43 220.59<br />
as % of total assets 95.1% 88.7% 84.6% 73.7% 72.6% 65.4%<br />
Intagible assets 20.36 18.43 25.75 33.42 39.10 32.26<br />
Property, plant and equipment 174.19 170.74 182.60 187.07 188.16 186.12<br />
Financial assets 0.97 1.43 0.35 0.35 0.35 0.35<br />
Income tax claims 6.63 4.92 1.67 1.75 1.77 1.81<br />
Other assets 0.00 0.13 0.03 0.03 0.05 0.05<br />
Other long-term receivables 2.43 0.97 0.00 0.00 0.00 0.00<br />
Current assets 10.59 25.11 38.30 79.50 86.72 116.59<br />
as % of total assets 4.9% 11.3% 15.4% 26.3% 27.4% 34.6%<br />
Inventories 1.79 2.33 5.81 8.68 7.21 7.63<br />
Accounts receivable, other receivables<br />
and other assets<br />
7.70 21.70 27.22 38.37 39.02 41.44<br />
Cash and cash equivalents 1.10 1.09 5.27 32.45 40.49 67.52<br />
Total assets 215.16 221.73 248.71 302.12 316.14 337.18<br />
Shareholders´ equity and liabilities<br />
Shareholders´ equity 62.03 67.63 93.46 140.65 159.44 178.90<br />
as % of total equity and liabilities 28.8% 30.5% 37.6% 46.6% 50.4% 53.1%<br />
Subscribed capital 61.43 61.43 61.43 61.43 61.43 61.43<br />
Capital reserve and others 0.45 6.00 31.81 78.79 97.33 116.49<br />
Own shares -0.14 -0.13 -0.12 -0.12 -0.12 -0.12<br />
Equity attributable to shareholders 61.74 67.30 93.11 140.09 158.64 177.79<br />
Minorities 0.28 0.33 0.35 0.56 0.81 1.11<br />
Current provisions and liabilities 70.42 63.37 61.95 68.17 66.18 66.57<br />
as % of total equity and liabilities 32.7% 28.6% 24.9% 22.6% 20.9% 19.7%<br />
Financial lease 0.29 0.53 1.28 1.28 1.41 1.41<br />
Financial liabilities 15.83 13.21 5.97 5.97 5.97 4.78<br />
Current provisions 36.08 19.68 19.22 19.22 19.41 19.80<br />
Accounts payable 6.46 10.53 9.64 15.86 13.16 13.94<br />
Current income tax liabilities 1.13 3.15 3.83 3.83 4.21 4.63<br />
Other current liabilities 10.63 16.27 22.01 22.01 22.01 22.01<br />
Non-current provisions and liabilities 82.72 90.74 93.31 93.31 90.52 91.72<br />
as % of total equity and liabilities 38.4% 40.9% 37.5% 30.9% 28.6% 27.2%<br />
Financial liabilities 58.55 47.90 41.27 41.27 37.14 38.63<br />
Financial lease 6.62 9.44 21.15 21.15 22.21 22.21<br />
Deferred tax liabilities 1.83 0.00 0.00 0.00 0.00 0.00<br />
Other payables and liabilities 15.72 33.39 30.89 30.89 31.18 30.89<br />
Total equity and liabilities 215.16 221.73 248.71 302.12 316.14 337.18<br />
Source: <strong>Borussia</strong> <strong>Dortmund</strong> GmbH & Co. KGaA, CBS <strong>Research</strong> <strong>AG</strong><br />
www.cbseydlerresearch.ag <strong>Close</strong> <strong>Brothers</strong> <strong>Seydler</strong> <strong>Research</strong> <strong>AG</strong> | 52