E N S W - Human Development Reports - United Nations ...
E N S W - Human Development Reports - United Nations ...
E N S W - Human Development Reports - United Nations ...

Create successful ePaper yourself
Turn your PDF publications into a flip-book with our unique Google optimized e-Paper software.
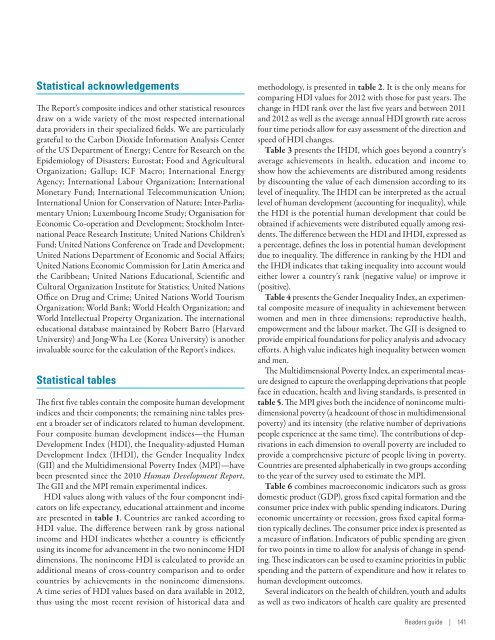
Statistical acknowledgements<br />
The Report’s composite indices and other statistical resources<br />
draw on a wide variety of the most respected international<br />
data providers in their specialized fields. We are particularly<br />
grateful to the Carbon Dioxide Information Analysis Center<br />
of the US Department of Energy; Centre for Research on the<br />
Epidemiology of Disasters; Eurostat; Food and Agricultural<br />
Organization; Gallup; ICF Macro; International Energy<br />
Agency; International Labour Organization; International<br />
Monetary Fund; International Telecommunication Union;<br />
International Union for Conservation of Nature; Inter-Parliamentary<br />
Union; Luxembourg Income Study; Organisation for<br />
Economic Co-operation and <strong>Development</strong>; Stockholm International<br />
Peace Research Institute; <strong>United</strong> <strong>Nations</strong> Children’s<br />
Fund; <strong>United</strong> <strong>Nations</strong> Conference on Trade and <strong>Development</strong>;<br />
<strong>United</strong> <strong>Nations</strong> Department of Economic and Social Affairs;<br />
<strong>United</strong> <strong>Nations</strong> Economic Commission for Latin America and<br />
the Caribbean; <strong>United</strong> <strong>Nations</strong> Educational, Scientific and<br />
Cultural Organization Institute for Statistics; <strong>United</strong> <strong>Nations</strong><br />
Office on Drug and Crime; <strong>United</strong> <strong>Nations</strong> World Tourism<br />
Organization; World Bank; World Health Organization; and<br />
World Intellectual Property Organization. The international<br />
educational database maintained by Robert Barro (Harvard<br />
University) and Jong-Wha Lee (Korea University) is another<br />
invaluable source for the calculation of the Report’s indices.<br />
Statistical tables<br />
The first five tables contain the composite human development<br />
indices and their components; the remaining nine tables present<br />
a broader set of indicators related to human development.<br />
Four composite human development indices—the <strong>Human</strong><br />
<strong>Development</strong> Index (HDI), the Inequality-adjusted <strong>Human</strong><br />
<strong>Development</strong> Index (IHDI), the Gender Inequality Index<br />
(GII) and the Multidimensional Poverty Index (MPI)—have<br />
been presented since the 2010 <strong>Human</strong> <strong>Development</strong> Report.<br />
The GII and the MPI remain experimental indices.<br />
HDI values along with values of the four component indicators<br />
on life expectancy, educational attainment and income<br />
are presented in table 1. Countries are ranked according to<br />
HDI value. The difference between rank by gross national<br />
income and HDI indicates whether a country is efficiently<br />
using its income for advancement in the two nonincome HDI<br />
dimensions. The nonincome HDI is calculated to provide an<br />
additional means of cross- country comparison and to order<br />
countries by achievements in the nonincome dimensions.<br />
A time series of HDI values based on data available in 2012,<br />
thus using the most recent revision of historical data and<br />
methodology, is presented in table 2. It is the only means for<br />
comparing HDI values for 2012 with those for past years. The<br />
change in HDI rank over the last five years and between 2011<br />
and 2012 as well as the average annual HDI growth rate across<br />
four time periods allow for easy assessment of the direction and<br />
speed of HDI changes.<br />
Table 3 presents the IHDI, which goes beyond a country’s<br />
average achievements in health, education and income to<br />
show how the achievements are distributed among residents<br />
by discounting the value of each dimension according to its<br />
level of inequality. The IHDI can be interpreted as the actual<br />
level of human development (accounting for inequality), while<br />
the HDI is the potential human development that could be<br />
obtained if achievements were distributed equally among residents.<br />
The difference between the HDI and IHDI, expressed as<br />
a percentage, defines the loss in potential human development<br />
due to inequality. The difference in ranking by the HDI and<br />
the IHDI indicates that taking inequality into account would<br />
either lower a country’s rank (negative value) or improve it<br />
(positive).<br />
Table 4 presents the Gender Inequality Index, an experimental<br />
composite measure of inequality in achievement between<br />
women and men in three dimensions: reproductive health,<br />
empowerment and the labour market. The GII is designed to<br />
provide empirical foundations for policy analysis and advocacy<br />
efforts. A high value indicates high inequality between women<br />
and men.<br />
The Multidimensional Poverty Index, an experimental measure<br />
designed to capture the overlapping deprivations that people<br />
face in education, health and living standards, is presented in<br />
table 5. The MPI gives both the incidence of nonincome multidimensional<br />
poverty (a headcount of those in multidimensional<br />
poverty) and its intensity (the relative number of deprivations<br />
people experience at the same time). The contributions of deprivations<br />
in each dimension to overall poverty are included to<br />
provide a comprehensive picture of people living in poverty.<br />
Countries are presented alphabetically in two groups according<br />
to the year of the survey used to estimate the MPI.<br />
Table 6 combines macroeconomic indicators such as gross<br />
domestic product (GDP), gross fixed capital formation and the<br />
consumer price index with public spending indicators. During<br />
economic uncertainty or recession, gross fixed capital formation<br />
typically declines. The consumer price index is presented as<br />
a measure of inflation. Indicators of public spending are given<br />
for two points in time to allow for analysis of change in spending.<br />
These indicators can be used to examine priorities in public<br />
spending and the pattern of expenditure and how it relates to<br />
human development outcomes.<br />
Several indicators on the health of children, youth and adults<br />
as well as two indicators of health care quality are presented<br />
Readers guide | 141