E N S W - Human Development Reports - United Nations ...
E N S W - Human Development Reports - United Nations ...
E N S W - Human Development Reports - United Nations ...

Create successful ePaper yourself
Turn your PDF publications into a flip-book with our unique Google optimized e-Paper software.
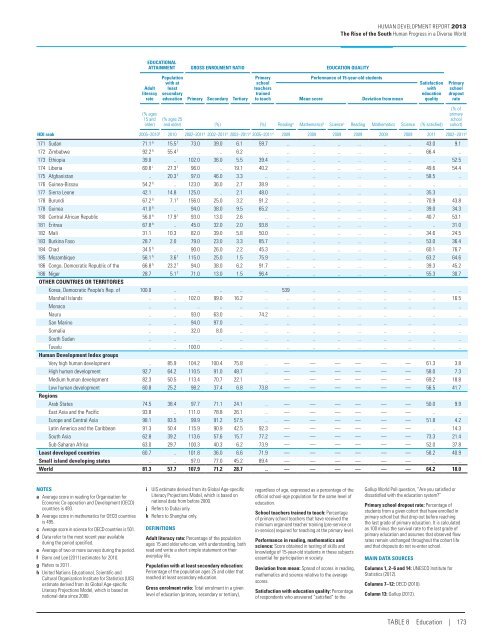
<strong>Human</strong> <strong>Development</strong> Report 2013<br />
The Rise of the South <strong>Human</strong> Progress in a Diverse World<br />
EDUCATIONAL<br />
ATTAINMENT GROSS ENROLMENT RATIO EDUCATION QUALITY<br />
Adult<br />
literacy<br />
rate<br />
Population<br />
with at<br />
least<br />
secondary<br />
education Primary Secondary Tertiary<br />
Primary<br />
school<br />
teachers<br />
trained<br />
to teach<br />
Performance of 15-year-old students<br />
Mean score<br />
Deviation from mean<br />
Satisfaction<br />
with<br />
education<br />
quality<br />
Primary<br />
school<br />
dropout<br />
rate<br />
(% ages<br />
15 and<br />
older)<br />
(% ages 25<br />
and older) (%) (%) Reading a Mathematics b Science c Reading Mathematics Science (% satisfied)<br />
(% of<br />
primary<br />
school<br />
cohort)<br />
HDI rank 2005–2010 d 2010 2002–2011 d 2002–2011 d 2002–2011 d 2005–2011 d 2009 2009 2009 2009 2009 2009 2011 2002–2011 d<br />
171 Sudan 71.1 h 15.5 f 73.0 39.0 6.1 59.7 .. .. .. .. .. .. 43.0 9.1<br />
172 Zimbabwe 92.2 h 55.4 f .. .. 6.2 .. .. .. .. .. .. .. 66.4 ..<br />
173 Ethiopia 39.0 .. 102.0 36.0 5.5 39.4 .. .. .. .. .. .. .. 52.5<br />
174 Liberia 60.8 i 27.3 f 96.0 .. 19.1 40.2 .. .. .. .. .. .. 49.6 54.4<br />
175 Afghanistan .. 20.3 f 97.0 46.0 3.3 .. .. .. .. .. .. .. 58.5 ..<br />
176 Guinea-Bissau 54.2 h .. 123.0 36.0 2.7 38.9 .. .. .. .. .. .. .. ..<br />
177 Sierra Leone 42.1 14.8 125.0 .. 2.1 48.0 .. .. .. .. .. .. 35.3 ..<br />
178 Burundi 67.2 h 7.1 f 156.0 25.0 3.2 91.2 .. .. .. .. .. .. 70.9 43.8<br />
178 Guinea 41.0 h .. 94.0 38.0 9.5 65.2 .. .. .. .. .. .. 39.0 34.3<br />
180 Central African Republic 56.0 h 17.9 f 93.0 13.0 2.6 .. .. .. .. .. .. .. 40.7 53.1<br />
181 Eritrea 67.8 h .. 45.0 32.0 2.0 93.8 .. .. .. .. .. .. .. 31.0<br />
182 Mali 31.1 10.3 82.0 39.0 5.8 50.0 .. .. .. .. .. .. 34.6 24.5<br />
183 Burkina Faso 28.7 2.0 79.0 23.0 3.3 85.7 .. .. .. .. .. .. 53.0 36.4<br />
184 Chad 34.5 h .. 90.0 26.0 2.2 45.3 .. .. .. .. .. .. 60.1 76.7<br />
185 Mozambique 56.1 h 3.6 f 115.0 25.0 1.5 75.9 .. .. .. .. .. .. 63.2 64.6<br />
186 Congo, Democratic Republic of the 66.8 h 23.2 f 94.0 38.0 6.2 91.7 .. .. .. .. .. .. 39.3 45.2<br />
186 Niger 28.7 5.1 f 71.0 13.0 1.5 96.4 .. .. .. .. .. .. 55.3 30.7<br />
Other countries or territories<br />
Korea, Democratic People’s Rep. of 100.0 .. .. .. .. .. 539 .. .. .. .. .. .. ..<br />
Marshall Islands .. .. 102.0 99.0 16.2 .. .. .. .. .. .. .. .. 16.5<br />
Monaco .. .. .. .. .. .. .. .. .. .. .. .. .. ..<br />
Nauru .. .. 93.0 63.0 .. 74.2 .. .. .. .. .. .. .. ..<br />
San Marino .. .. 94.0 97.0 .. .. .. .. .. .. .. .. .. ..<br />
Somalia .. .. 32.0 8.0 .. .. .. .. .. .. .. .. .. ..<br />
South Sudan .. .. .. .. .. .. .. .. .. .. .. .. .. ..<br />
Tuvalu .. .. 100.0 .. .. .. .. .. .. .. .. .. .. ..<br />
<strong>Human</strong> <strong>Development</strong> Index groups<br />
Very high human development .. 85.9 104.2 100.4 75.8 .. — — — — — — 61.3 3.8<br />
High human development 92.7 64.2 110.5 91.0 48.7 .. — — — — — — 58.0 7.3<br />
Medium human development 82.3 50.5 113.4 70.7 22.1 .. — — — — — — 69.2 18.8<br />
Low human development 60.8 25.2 98.2 37.4 6.8 73.8 — — — — — — 56.5 41.7<br />
Regions<br />
Arab States 74.5 38.4 97.7 71.1 24.1 .. — — — — — — 50.0 9.9<br />
East Asia and the Pacific 93.8 .. 111.0 78.8 26.1 .. — — — — — — .. ..<br />
Europe and Central Asia 98.1 83.5 99.9 91.2 57.5 .. — — — — — — 51.8 4.2<br />
Latin America and the Caribbean 91.3 50.4 115.9 90.9 42.5 92.3 — — — — — — .. 14.3<br />
South Asia 62.8 39.2 113.6 57.6 15.7 77.2 — — — — — — 73.3 21.4<br />
Sub-Saharan Africa 63.0 29.7 100.3 40.3 6.2 73.9 — — — — — — 52.0 37.8<br />
Least developed countries 60.7 .. 101.8 36.0 6.6 71.9 — — — — — — 58.2 40.9<br />
Small island developing states .. .. 97.0 77.0 45.2 89.4 — — — — — — .. ..<br />
World 81.3 57.7 107.9 71.2 28.7 .. — — — — — — 64.2 18.0<br />
NOTES<br />
a Average score in reading for Organisation for<br />
Economic Co-operation and <strong>Development</strong> (OECD)<br />
countries is 493.<br />
b Average score in mathematics for OECD countries<br />
is 495.<br />
c Average score in science for OECD countries is 501.<br />
d Data refer to the most recent year available<br />
during the period specified.<br />
e Average of two or more surveys during the period.<br />
f Barro and Lee (2011) estimates for 2010.<br />
g Refers to 2011.<br />
h <strong>United</strong> <strong>Nations</strong> Educational, Scientific and<br />
Cultural Organization Institute for Statistics (UIS)<br />
estimate derived from its Global Age-specific<br />
Literacy Projections Model, which is based on<br />
national data since 2000.<br />
i UIS estimate derived from its Global Age-specific<br />
Literacy Projections Model, which is based on<br />
national data from before 2000.<br />
j Refers to Dubai only.<br />
k Refers to Shanghai only.<br />
DEFINITIONS<br />
Adult literacy rate: Percentage of the population<br />
ages 15 and older who can, with understanding, both<br />
read and write a short simple statement on their<br />
everyday life.<br />
Population with at least secondary education:<br />
Percentage of the population ages 25 and older that<br />
reached at least secondary education.<br />
Gross enrolment ratio: Total enrolment in a given<br />
level of education (primary, secondary or tertiary),<br />
regardless of age, expressed as a percentage of the<br />
official school-age population for the same level of<br />
education.<br />
School teachers trained to teach: Percentage<br />
of primary school teachers that have received the<br />
minimum organized teacher training (pre-service or<br />
in-service) required for teaching at the primary level.<br />
Performance in reading, mathematics and<br />
science: Score obtained in testing of skills and<br />
knowledge of 15-year-old students in these subjects<br />
essential for participation in society.<br />
Deviation from mean: Spread of scores in reading,<br />
mathematics and science relative to the average<br />
scores.<br />
Satisfaction with education quality: Percentage<br />
of respondents who answered “satisfied” to the<br />
Gallup World Poll question, “Are you satisfied or<br />
dissatisfied with the education system?”<br />
Primary school dropout rate: Percentage of<br />
students from a given cohort that have enrolled in<br />
primary school but that drop out before reaching<br />
the last grade of primary education. It is calculated<br />
as 100 minus the survival rate to the last grade of<br />
primary education and assumes that observed flow<br />
rates remain unchanged throughout the cohort life<br />
and that dropouts do not re-enter school.<br />
MAIN DATA SOURCES<br />
Columns 1, 2–6 and 14: UNESCO Institute for<br />
Statistics (2012).<br />
Columns 7–12: OECD (2010).<br />
Column 13: Gallup (2012).<br />
Table 8 Education | 173