E N S W - Human Development Reports - United Nations ...
E N S W - Human Development Reports - United Nations ...
E N S W - Human Development Reports - United Nations ...

Create successful ePaper yourself
Turn your PDF publications into a flip-book with our unique Google optimized e-Paper software.
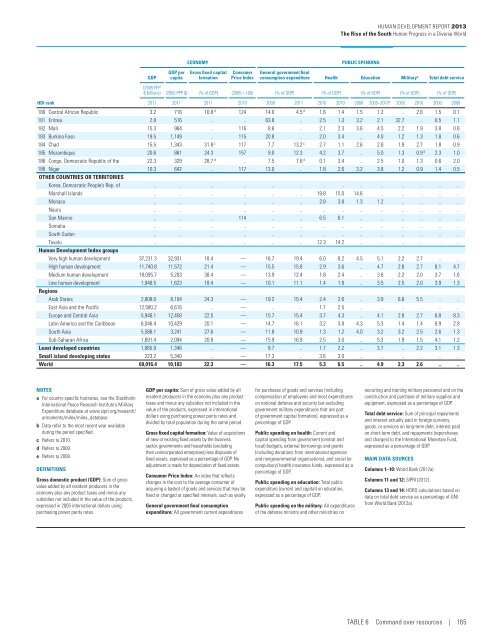
<strong>Human</strong> <strong>Development</strong> Report 2013<br />
The Rise of the South <strong>Human</strong> Progress in a Diverse World<br />
ECONOMY<br />
PUBLIC SPENDING<br />
GDP<br />
GDP per<br />
capita<br />
Gross fixed capital<br />
formation<br />
Consumer<br />
Price Index<br />
General government final<br />
consumption expenditure Health Education Military a Total debt service<br />
(2005 PPP<br />
$ billions) (2005 PPP $) (% of GDP) (2005 = 100) (% of GDP) (% of GDP) (% of GDP) (% of GDP) (% of GDP)<br />
HDI rank 2011 2011 2011 2010 2000 2011 2010 2010 2000 2005–2010 b 2000 2010 2000 2009<br />
180 Central African Republic 3.2 716 10.8 d 124 14.0 4.5 d 1.6 1.4 1.5 1.2 .. 2.6 1.5 0.1<br />
181 Eritrea 2.8 516 .. .. 63.8 .. 2.5 1.3 3.2 2.1 32.7 .. 0.5 1.1<br />
182 Mali 15.3 964 .. 116 8.6 .. 2.1 2.3 3.6 4.5 2.2 1.9 3.8 0.6<br />
183 Burkina Faso 19.5 1,149 .. 115 20.8 .. 2.0 3.4 .. 4.0 1.2 1.3 1.8 0.6<br />
184 Chad 15.5 1,343 31.8 c 117 7.7 13.2 c 2.7 1.1 2.6 2.8 1.9 2.7 1.8 0.9<br />
185 Mozambique 20.6 861 24.3 157 9.0 12.3 4.2 3.7 .. 5.0 1.3 0.9 d 2.3 1.0<br />
186 Congo, Democratic Republic of the 22.3 329 28.7 d .. 7.5 7.6 d 0.1 3.4 .. 2.5 1.0 1.3 0.6 2.0<br />
186 Niger 10.3 642 .. 117 13.0 .. 1.8 2.6 3.2 3.8 1.2 0.9 1.4 0.5<br />
Other countries or territories<br />
Korea, Democratic People’s Rep. of .. .. .. .. .. .. .. .. .. .. .. .. .. ..<br />
Marshall Islands .. .. .. .. .. .. 19.8 15.0 14.6 .. .. .. .. ..<br />
Monaco .. .. .. .. .. .. 2.8 3.8 1.3 1.2 .. .. .. ..<br />
Nauru .. .. .. .. .. .. .. .. .. .. .. .. .. ..<br />
San Marino .. .. .. 114 .. .. 6.5 6.1 .. .. .. .. .. ..<br />
Somalia .. .. .. .. .. .. .. .. .. .. .. .. .. ..<br />
South Sudan .. .. .. .. .. .. .. .. .. .. .. .. .. ..<br />
Tuvalu .. .. .. .. .. .. 12.3 14.2 .. .. .. .. .. ..<br />
<strong>Human</strong> <strong>Development</strong> Index groups<br />
Very high human development 37,231.3 32,931 18.4 — 16.7 19.4 6.0 8.2 4.5 5.1 2.2 2.7 .. ..<br />
High human development 11,740.8 11,572 21.4 — 15.5 15.8 2.9 3.6 .. 4.7 2.8 2.7 8.1 4.7<br />
Medium human development 18,095.7 5,203 38.4 — 13.9 12.4 1.8 2.4 .. 3.6 2.2 2.0 3.7 1.6<br />
Low human development 1,948.5 1,623 18.4 — 10.1 11.1 1.4 1.8 .. 3.5 2.5 2.0 3.9 1.3<br />
Regions<br />
Arab States 2,808.0 8,104 24.3 — 19.2 15.4 2.4 2.6 .. 3.9 6.8 5.5 .. ..<br />
East Asia and the Pacific 12,580.2 6,616 .. — .. .. 1.7 2.5 .. .. .. .. .. ..<br />
Europe and Central Asia 5,946.1 12,458 22.5 — 15.7 15.4 3.7 4.3 .. 4.1 2.8 2.7 6.8 8.3<br />
Latin America and the Caribbean 6,046.4 10,429 20.1 — 14.7 16.1 3.2 3.8 4.3 5.3 1.4 1.4 8.9 2.8<br />
South Asia 5,586.1 3,241 27.6 — 11.8 10.9 1.3 1.2 4.0 3.2 3.2 2.5 2.6 1.3<br />
Sub-Saharan Africa 1,691.4 2,094 20.8 — 15.9 16.9 2.5 3.0 .. 5.2 1.9 1.5 4.1 1.2<br />
Least developed countries 1,065.9 1,346 .. — 9.7 .. 1.7 2.2 .. 3.7 .. 2.2 3.1 1.3<br />
Small island developing states 223.2 5,340 .. — 17.3 .. 3.6 3.0 .. .. .. .. .. ..<br />
World 69,016.4 10,103 22.3 — 16.3 17.5 5.3 6.5 .. 4.9 2.3 2.6 .. ..<br />
NOTES<br />
a For country-specific footnotes, see the Stockholm<br />
International Peace Research Institute’s Military<br />
Expenditure database at www.sipri.org/research/<br />
armaments/milex/milex_database.<br />
b Data refer to the most recent year available<br />
during the period specified.<br />
c Refers to 2010.<br />
d Refers to 2009.<br />
e Refers to 2008.<br />
DEFINITIONS<br />
Gross domestic product (GDP): Sum of gross<br />
value added by all resident producers in the<br />
economy plus any product taxes and minus any<br />
subsidies not included in the value of the products,<br />
expressed in 2005 international dollars using<br />
purchasing power parity rates.<br />
GDP per capita: Sum of gross value added by all<br />
resident producers in the economy plus any product<br />
taxes and minus any subsidies not included in the<br />
value of the products, expressed in international<br />
dollars using purchasing power parity rates and<br />
divided by total population during the same period.<br />
Gross fixed capital formation: Value of acquisitions<br />
of new or existing fixed assets by the business<br />
sector, governments and households (excluding<br />
their unincorporated enterprises) less disposals of<br />
fixed assets, expressed as a percentage of GDP. No<br />
adjustment is made for depreciation of fixed assets.<br />
Consumer Price Index: An index that reflects<br />
changes in the cost to the average consumer of<br />
acquiring a basket of goods and services that may be<br />
fixed or changed at specified intervals, such as yearly.<br />
General government final consumption<br />
expenditure: All government current expenditures<br />
for purchases of goods and services (including<br />
compensation of employees and most expenditures<br />
on national defense and security but excluding<br />
government military expenditures that are part<br />
of government capital formation), expressed as a<br />
percentage of GDP.<br />
Public spending on health: Current and<br />
capital spending from government (central and<br />
local) budgets, external borrowings and grants<br />
(including donations from international agencies<br />
and nongovernmental organizations), and social (or<br />
compulsory) health insurance funds, expressed as a<br />
percentage of GDP.<br />
Public spending on education: Total public<br />
expenditure (current and capital) on education,<br />
expressed as a percentage of GDP.<br />
Public spending on the military: All expenditures<br />
of the defense ministry and other ministries on<br />
recruiting and training military personnel and on the<br />
construction and purchase of military supplies and<br />
equipment, expressed as a percentage of GDP.<br />
Total debt service: Sum of principal repayments<br />
and interest actually paid in foreign currency,<br />
goods, or services on long-term debt, interest paid<br />
on short-term debt, and repayments (repurchases<br />
and charges) to the International Monetary Fund,<br />
expressed as a percentage of GDP.<br />
MAIN DATA SOURCES<br />
Columns 1–10: World Bank (2012a).<br />
Columns 11 and 12: SIPRI (2012).<br />
Columns 13 and 14: HDRO calculations based on<br />
data on total debt service as a percentage of GNI<br />
from World Bank (2012a).<br />
Table 6 Command over resources | 165