Dynamic City-Regions in India Presentations for five (5 ... - Unido
Dynamic City-Regions in India Presentations for five (5 ... - Unido
Dynamic City-Regions in India Presentations for five (5 ... - Unido

Create successful ePaper yourself
Turn your PDF publications into a flip-book with our unique Google optimized e-Paper software.
Of the 678 medium and large-scale <strong>in</strong>dustrial units <strong>in</strong> the State, 300<br />
are located <strong>in</strong> and around Bangalore. There are about 115 thousand<br />
small-scale <strong>in</strong>dustrial units, <strong>in</strong> Karnataka. About 21 per cent of these<br />
are located <strong>in</strong> and around Bangalore.<br />
Table 3. Number of Industries, Karnataka<br />
Karnataka<br />
Large & Medium Industries 678 units<br />
Investment<br />
US$ 6813 Million<br />
Employment 4,46,809<br />
Table 4. Karnataka Region: Facts and Figures<br />
Number of Industrial Estates: 89<br />
Area<br />
1,92,204 square kilometres (eighth largest <strong>in</strong><br />
<strong>India</strong>)<br />
Number of Sheds Industrial 3,920<br />
Between 11º31' and 18º45' North Latitudes -<br />
Areas developed<br />
Location (South <strong>India</strong>n Pen<strong>in</strong>sula) 74º12' and 78º40'<br />
Longitudes<br />
Small Scale Industries 115,000 un its<br />
Annual Ra<strong>in</strong>fall 1100mm<br />
Investment<br />
US$ 1102 Million<br />
Employment 1,505,800<br />
1. Population<br />
a) Karnataka population<br />
State/UT*<br />
POPULATION<br />
Population Variation Sex ratio<br />
Persons Males Females<br />
1991-2001 (Females per 000 males)<br />
Karnataka 52,733,958 26,856,343 25,877,615 17.25 964<br />
Table 5. Karnataka population (Source: Provisional Population Totals: <strong>India</strong>. Census of <strong>India</strong> 2001)<br />
b) Bangalore population<br />
Population:<br />
Population (0 – 6 years):<br />
Persons 4,292,223 Persons: 458,537<br />
Males 2,240,956 Males 235,755<br />
Females 2,051,267 Females 222,782<br />
Sex Ratio: 915<br />
Sex Ratio: 945<br />
Number of Literates:<br />
Persons: 3,326,983<br />
Males: 1,803,476<br />
Females: 1,523,507<br />
Sex Ratio: 845<br />
Table 6. Bangalore population Source: Provisional Population Totals: <strong>India</strong>. Census of <strong>India</strong> 2001)<br />
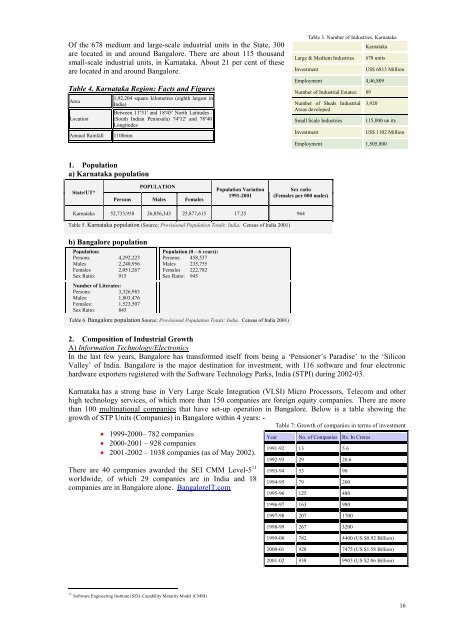
• 1999-2000– 782 companies<br />
Year No. of Companies Rs. In Crores<br />
• 2000-2001 – 928 companies<br />
1991-92 13 5.6<br />
• 2001-2002 – 1038 companies (as of May 2002).<br />
1992-93 29 20.6<br />
There are 40 companies awarded the SEI CMM Level-5 11 1993-94 53 90<br />
worldwide, of which 29 companies are <strong>in</strong> <strong>India</strong> and 18<br />
1994-95 79 200<br />
companies are <strong>in</strong> Bangalore alone. BangaloreIT.com<br />
1995-96 125 480<br />
1996-97 163 980<br />
1997-98 207 1700<br />
1998-99 267 3200<br />
1999-00 782 4400 (US $0.92 Billion)<br />
2000-01 928 7475 (US $1.58 Billion)<br />
2001-02 938 9903 (US $2.06 Billion)<br />
2. Composition of Industrial Growth<br />
A) In<strong>for</strong>mation Technology/Electronics<br />
In the last few years, Bangalore has trans<strong>for</strong>med itself from be<strong>in</strong>g a ‘Pensioner’s Paradise’ to the ‘Silicon<br />
Valley’ of <strong>India</strong>. Bangalore is the major dest<strong>in</strong>ation <strong>for</strong> <strong>in</strong>vestment, with 116 software and four electronic<br />
hardware exporters registered with the Software Technology Parks, <strong>India</strong> (STPI) dur<strong>in</strong>g 2002-03.<br />
Karnataka has a strong base <strong>in</strong> Very Large Scale Integration (VLSI) Micro Processors, Telecom and other<br />
high technology services, of which more than 150 companies are <strong>for</strong>eign equity companies. There are more<br />
than 100 mult<strong>in</strong>ational companies that have set-up operation <strong>in</strong> Bangalore. Below is a table show<strong>in</strong>g the<br />
growth of STP Units (Companies) <strong>in</strong> Bangalore with<strong>in</strong> 4 years: -<br />
Table 7: Growth of companies <strong>in</strong> terms of <strong>in</strong>vestment<br />
16