Meridian Annual Report - Meridian Energy
Meridian Annual Report - Meridian Energy
Meridian Annual Report - Meridian Energy

You also want an ePaper? Increase the reach of your titles
YUMPU automatically turns print PDFs into web optimized ePapers that Google loves.
35<<br />
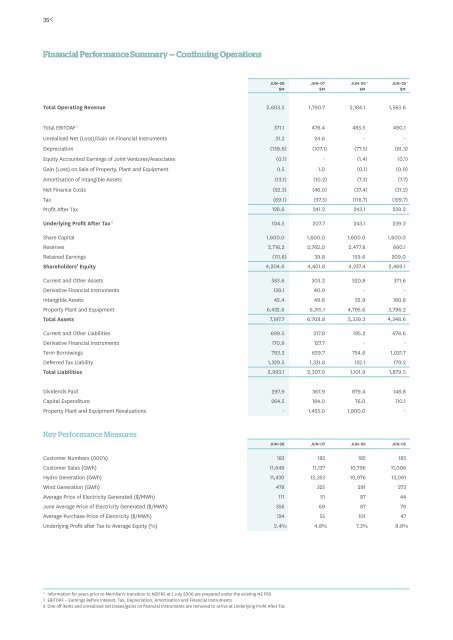
Financial Performance Summary — Continuing Operations<br />
Jun-08<br />
$m<br />
Jun-07<br />
$m<br />
Jun-06 *<br />
$m<br />
Jun-05 *<br />
$m<br />
Total Operating Revenue 2,603.5 1,790.7 2,184.1 1,563.6<br />
Total EBITDAF 1 371.1 476.4 483.5 490.1<br />
Unrealised Net (Loss)/Gain on Financial Instruments 31.2 24.6 - -<br />
Depreciation (139.6) (107.1) (77.5) (81.3)<br />
Equity Accounted Earnings of Joint Ventures/Associates (0.1) - (1.4) (0.1)<br />
Gain (Loss) on Sale of Property, Plant and Equipment 0.5 1.0 (0.1) (0.9)<br />
Amortisation of Intangible Assets (13.1) (10.2) (7.3) (7.7)<br />
Net Finance Costs (52.3) (46.0) (37.4) (31.2)<br />
Tax (69.1) (97.5) (116.7) (129.7)<br />
Profit After Tax 128.6 241.2 243.1 239.2<br />
Underlying Profit After Tax 2 104.5 207.7 243.1 239.2<br />
Share Capital 1,600.0 1,600.0 1,600.0 1,600.0<br />
Reserves 2,716.2 2,762.0 2,477.8 660.1<br />
Retained Earnings (111.6) 39.8 159.6 209.0<br />
Shareholders’ Equity 4,204.6 4,401.8 4,237.4 2,469.1<br />
Current and Other Assets 583.6 303.2 520.8 371.6<br />
Derivative Financial Instruments 139.1 40.9 - -<br />
Intangible Assets 42.4 49.6 22.9 180.8<br />
Property Plant and Equipment 6,432.6 6,315.1 4,795.6 3,796.2<br />
Total Assets 7,197.7 6,708.8 5,339.3 4,348.6<br />
Current and Other Liabilities 699.5 217.8 195.2 678.6<br />
Derivative Financial Instruments 170.9 127.7 - -<br />
Term Borrowings 793.2 629.7 754.6 1,021.7<br />
Deferred Tax Liability 1,329.5 1,331.8 152.1 179.2<br />
Total Liabilities 2,993.1 2,307.0 1,101.9 1,879.5<br />
Dividends Paid 297.9 367.9 879.4 148.8<br />
Capital Expenditure 264.5 184.0 76.0 110.1<br />
Property Plant and Equipment Revaluations - 1,455.0 1,800.0 -<br />
Key Performance Measures<br />
Jun-08 Jun-07 Jun-06 Jun-05<br />
Customer Numbers (000’s) 183 182 182 185<br />
Customer Sales (GWh) 11,649 11,137 10,796 11,006<br />
Hydro Generation (GWh) 11,430 12,353 10,976 13,091<br />
Wind Generation (GWh) 478 325 291 273<br />
Average Price of Electricity Generated ($/MWh) 111 51 97 44<br />
June Average Price of Electricity Generated ($/MWh) 356 69 87 79<br />
Average Purchase Price of Electricity ($/MWh) 124 55 101 47<br />
Underlying Profit after Tax to Average Equity (%) 2.4% 4.8% 7.3% 9.8%<br />
* Information for years prior to <strong>Meridian</strong>’s transition to NZIFRS at 1 July 2006 are prepared under the existing NZ FRS<br />
1 EBITDAF – Earnings Before Interest, Tax, Depreciation, Amortisation and Financial Instruments<br />
2 One off items and unrealised net losses/gains on financial instruments are removed to arrive at Underlying Profit After Tax