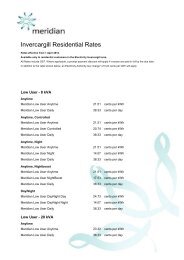
Meridian Annual Report - Meridian Energy
Meridian Annual Report - Meridian Energy
Meridian Annual Report - Meridian Energy

Create successful ePaper yourself
Turn your PDF publications into a flip-book with our unique Google optimized e-Paper software.
61<<br />
<strong>Meridian</strong> <strong>Energy</strong> Limited — Notes to the Financial Statements (continued)<br />
17. Property, Plant and Equipment<br />
group<br />
Generation<br />
Structures<br />
& Plant<br />
at Fair Value<br />
$’000<br />
Freehold<br />
Land<br />
at Cost<br />
$’000<br />
Freehold<br />
Buildings<br />
at Cost<br />
$’000<br />
Resource<br />
Consents<br />
at Cost<br />
$’000<br />
Other<br />
Plant and<br />
Equipment<br />
at Cost<br />
$’000<br />
Capital<br />
Work in<br />
Progress<br />
at Cost<br />
$’000<br />
Total<br />
$’000<br />
Cost or Fair Value<br />
Balance at 1 July 2006 4,609,256 35,013 9,806 7,851 75,910 94,869 4,832,705<br />
Additions - 3,090 405 - 611 175,290 179,396<br />
Transfers from Capital Work in Progress 166,222 - 366 - 15,698 (185,734) (3,448)<br />
Disposals (771) (1,749) (81) - (3,563) - (6,164)<br />
Reclassification (735) - - 735 - - -<br />
Revaluation Increments 1,444,493 - - - - 10,507 1,455,000<br />
Offset of Accumulated Depreciation on Revalued Assets (98,003) - - - - - (98,003)<br />
Effect of Acquisition of Controlled Entities - - - - 4,783 - 4,783<br />
Balance at 30 June 2007 6,120,462 36,354 10,496 8,586 93,439 94,932 6,364,269<br />
Balance at 1 July 2007 6,120,462 36,354 10,496 8,586 93,439 94,932 6,364,269<br />
Additions - - - - 617 268,594 269,211<br />
Transfers from Capital Work in Progress 16,301 7,890 2,351 - 30,913 (53,937) 3,518<br />
Transfers to Assets Classified as Held For Sale - (6,656) (917) - (668) - (8,241)<br />
Disposals (1,656) (3,844) (1,041) - (6,222) - (12,763)<br />
Reclassification 108 - (7) - (101) - -<br />
Balance at 30 June 2008 6,135,215 33,744 10,882 8,586 117,978 309,589 6,615,994<br />
Accumulated Depreciation and Impairment<br />
Balance at 1 July 2006 - - (1,229) (1,151) (38,349) - (40,729)<br />
Depreciation Expense (98,003) - (260) (170) (8,699) - (107,132)<br />
Disposals - - 5 - 3,413 - 3,418<br />
Offset of Accumulated Depreciation on Revalued Assets 98,003 - - - - - 98,003<br />
Effect of Acquisition of Controlled Entities - - - - (2,756) - (2,756)<br />
Balance at 30 June 2007 - - (1,484) (1,321) (46,391) - (49,196)<br />
Balance at 1 July 2007 - - (1,484) (1,321) (46,391) - (49,196)<br />
Depreciation Expense (129,267) - (352) (180) (9,757) - (139,556)<br />
Disposals 11 - 144 - 4,936 - 5,091<br />
Transfer to Assets Classified as Held For Sale - - 92 - 165 - 257<br />
Balance at 30 June 2008 (129,256) - (1,600) (1,501) (51,047) - (183,404)<br />
Net Book Value<br />
Net Book Value 30 June 2006 4,609,256 35,013 8,577 6,700 37,561 94,869 4,791,976<br />
Net Book Value 30 June 2007 6,120,462 36,354 9,012 7,265 47,048 94,932 6,315,073<br />
Net Book Value 30 June 2008 6,005,959 33,744 9,282 7,085 66,931 309,589 6,432,590